
|
Valoración DCF de Limbach Holdings, Inc. (LMB) |
Completamente Editable: Adáptelo A Sus Necesidades En Excel O Sheets
Diseño Profesional: Plantillas Confiables Y Estándares De La Industria
Predeterminadas Para Un Uso Rápido Y Eficiente
Compatible con MAC / PC, completamente desbloqueado
No Se Necesita Experiencia; Fáciles De Seguir
Limbach Holdings, Inc. (LMB) Bundle
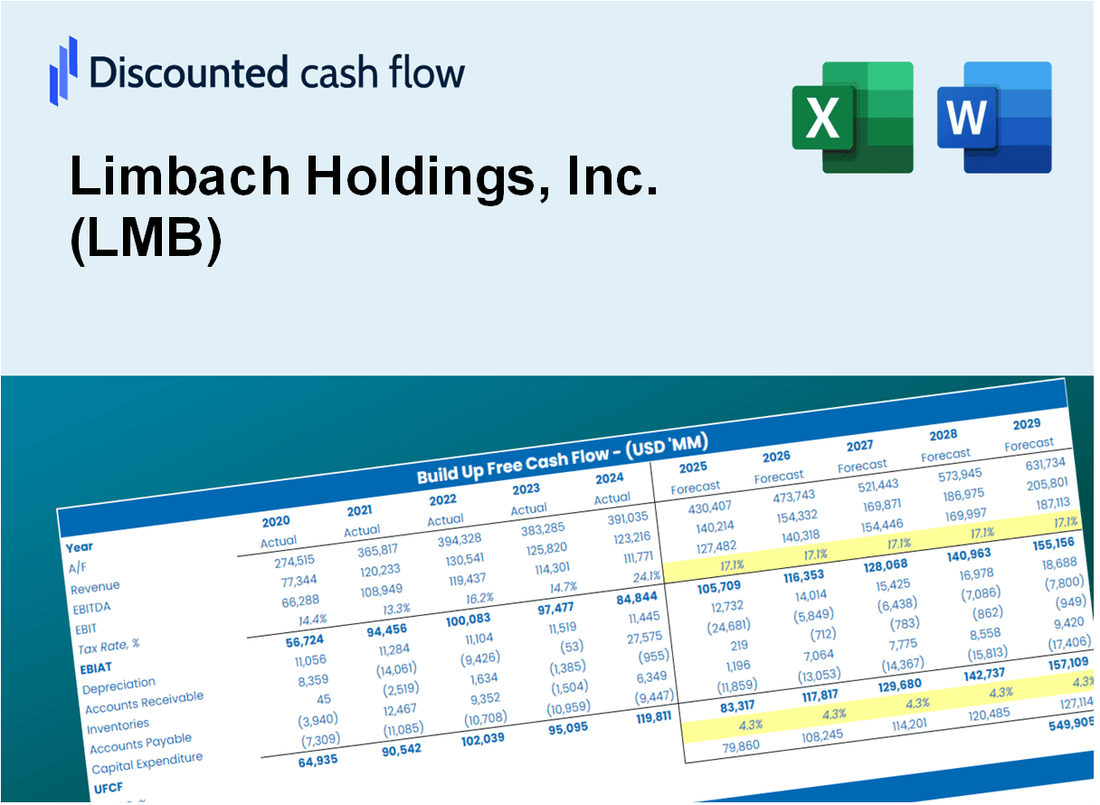
¡Simplifique la valoración de Limbach Holdings, Inc. (LMB) con esta calculadora DCF personalizable! Con Real Limbach Holdings, Inc. (LMB) financieras y entradas de pronóstico ajustables, puede probar escenarios y descubrir Limbach Holdings, Inc. (LMB) valor razonable en minutos.
What You Will Get
- Real Limbach Data: Preloaded financials – from revenue to EBIT – based on actual and projected figures for Limbach Holdings, Inc. (LMB).
- Full Customization: Adjust all critical parameters (yellow cells) such as WACC, growth %, and tax rates to suit your analysis.
- Instant Valuation Updates: Automatic recalculations to assess the impact of changes on Limbach Holdings’ fair value.
- Versatile Excel Template: Designed for quick edits, scenario testing, and detailed financial projections.
- Time-Saving and Accurate: Eliminate the need to build models from scratch while ensuring precision and flexibility.
Key Features
- Comprehensive Financial Data: Gain access to precise pre-loaded historical performance and future forecasts for Limbach Holdings, Inc. (LMB).
- Adjustable Forecast Parameters: Modify highlighted cells for key metrics such as WACC, growth rates, and profit margins.
- Real-Time Calculations: Enjoy automatic updates for DCF, Net Present Value (NPV), and cash flow evaluations.
- Interactive Dashboard: Utilize user-friendly charts and summaries to clearly visualize your valuation outcomes.
- Designed for All Skill Levels: A straightforward, intuitive layout tailored for investors, CFOs, and consultants alike.
How It Works
- 1. Access the Model: Download and open the Excel template containing Limbach Holdings, Inc. (LMB) data.
- 2. Adjust Inputs: Modify essential parameters such as growth projections, WACC, and capital investments.
- 3. Analyze Results in Real-Time: The DCF model automatically computes intrinsic value and NPV based on your inputs.
- 4. Explore Different Scenarios: Evaluate various forecasts to understand potential valuation variations.
- 5. Present with Assurance: Deliver expert valuation analyses to back your strategic decisions.
Why Choose This Calculator for Limbach Holdings, Inc. (LMB)?
- Accuracy: Utilizes real Limbach financials to ensure precise data.
- Flexibility: Built for users to easily test and adjust inputs as needed.
- Time-Saving: Avoid the complexities of creating a DCF model from the ground up.
- Professional-Grade: Crafted with the precision and usability expected at the CFO level.
- User-Friendly: Intuitive design makes it accessible for users without extensive financial modeling skills.
Who Should Use Limbach Holdings, Inc. (LMB)?
- Investors: Gain insights and make informed decisions with a robust analysis tool tailored for Limbach Holdings, Inc. (LMB).
- Financial Analysts: Streamline your workflow with a comprehensive financial model specifically designed for Limbach Holdings, Inc. (LMB).
- Consultants: Easily modify the framework for client engagements or presentations focused on Limbach Holdings, Inc. (LMB).
- Finance Enthusiasts: Enhance your knowledge of the construction and engineering sector through detailed examples from Limbach Holdings, Inc. (LMB).
- Educators and Students: Utilize this resource as an effective teaching aid in courses related to finance and business analysis involving Limbach Holdings, Inc. (LMB).
What the Template Contains
- Operating and Balance Sheet Data: Pre-filled Limbach Holdings historical data and forecasts, including revenue, EBITDA, EBIT, and capital expenditures.
- WACC Calculation: A dedicated sheet for Weighted Average Cost of Capital (WACC), including parameters like Beta, risk-free rate, and share price.
- DCF Valuation (Unlevered and Levered): Editable Discounted Cash Flow models showing intrinsic value with detailed calculations.
- Financial Statements: Pre-loaded financial statements (annual and quarterly) to support analysis.
- Key Ratios: Includes profitability, leverage, and efficiency ratios for Limbach Holdings, Inc. (LMB).
- Dashboard and Charts: Visual summary of valuation outputs and assumptions to analyze results easily.
Disclaimer
All information, articles, and product details provided on this website are for general informational and educational purposes only. We do not claim any ownership over, nor do we intend to infringe upon, any trademarks, copyrights, logos, brand names, or other intellectual property mentioned or depicted on this site. Such intellectual property remains the property of its respective owners, and any references here are made solely for identification or informational purposes, without implying any affiliation, endorsement, or partnership.
We make no representations or warranties, express or implied, regarding the accuracy, completeness, or suitability of any content or products presented. Nothing on this website should be construed as legal, tax, investment, financial, medical, or other professional advice. In addition, no part of this site—including articles or product references—constitutes a solicitation, recommendation, endorsement, advertisement, or offer to buy or sell any securities, franchises, or other financial instruments, particularly in jurisdictions where such activity would be unlawful.
All content is of a general nature and may not address the specific circumstances of any individual or entity. It is not a substitute for professional advice or services. Any actions you take based on the information provided here are strictly at your own risk. You accept full responsibility for any decisions or outcomes arising from your use of this website and agree to release us from any liability in connection with your use of, or reliance upon, the content or products found herein.