
|
Valoración DCF de The Lovesac Company (LOVE) |
Completamente Editable: Adáptelo A Sus Necesidades En Excel O Sheets
Diseño Profesional: Plantillas Confiables Y Estándares De La Industria
Predeterminadas Para Un Uso Rápido Y Eficiente
Compatible con MAC / PC, completamente desbloqueado
No Se Necesita Experiencia; Fáciles De Seguir
The Lovesac Company (LOVE) Bundle
¡Explore el potencial financiero (amor) de la compañía Lovesac con nuestra calculadora DCF fácil de usar! Ingrese sus proyecciones para el crecimiento, los márgenes y los gastos para descubrir el valor intrínseco (amor) de la compañía Lovesac e informar sus decisiones de inversión.
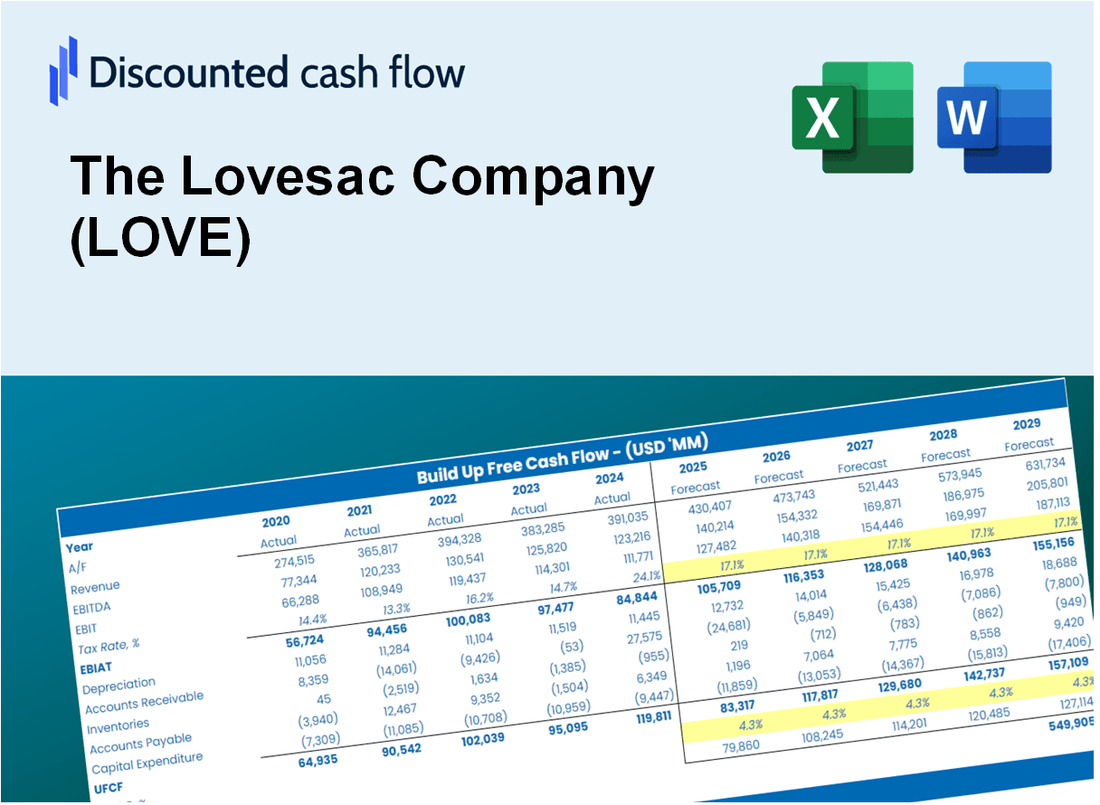
Discounted Cash Flow (DCF) - (USD MM)
| Year | AY1 2021 |
AY2 2022 |
AY3 2023 |
AY4 2024 |
AY5 2025 |
FY1 2026 |
FY2 2027 |
FY3 2028 |
FY4 2029 |
FY5 2030 |
|---|---|---|---|---|---|---|---|---|---|---|
| Revenue | 320.7 | 498.2 | 651.2 | 700.3 | 680.6 | 835.1 | 1,024.6 | 1,257.1 | 1,542.4 | 1,892.4 |
| Revenue Growth, % | 0 | 55.34 | 30.7 | 7.54 | -2.8 | 22.69 | 22.69 | 22.69 | 22.69 | 22.69 |
| EBITDA | 21.5 | 48.4 | 47.8 | 42.7 | 28.4 | 56.8 | 69.7 | 85.5 | 105.0 | 128.8 |
| EBITDA, % | 6.7 | 9.72 | 7.34 | 6.09 | 4.17 | 6.81 | 6.81 | 6.81 | 6.81 | 6.81 |
| Depreciation | 6.6 | 7.9 | 10.8 | 12.6 | 14.7 | 15.5 | 19.0 | 23.3 | 28.6 | 35.1 |
| Depreciation, % | 2.06 | 1.58 | 1.66 | 1.8 | 2.16 | 1.85 | 1.85 | 1.85 | 1.85 | 1.85 |
| EBIT | 14.9 | 40.6 | 37.0 | 30.1 | 13.6 | 41.4 | 50.7 | 62.3 | 76.4 | 93.7 |
| EBIT, % | 4.64 | 8.14 | 5.68 | 4.29 | 2.01 | 4.95 | 4.95 | 4.95 | 4.95 | 4.95 |
| Total Cash | 78.3 | 92.4 | 43.5 | 87.0 | 83.7 | 124.2 | 152.4 | 187.0 | 229.5 | 281.5 |
| Total Cash, percent | .0 | .0 | .0 | .0 | .0 | .0 | .0 | .0 | .0 | .0 |
| Account Receivables | 6.0 | 8.8 | 9.1 | 13.5 | 16.8 | 15.7 | 19.3 | 23.7 | 29.0 | 35.6 |
| Account Receivables, % | 1.86 | 1.76 | 1.4 | 1.92 | 2.47 | 1.88 | 1.88 | 1.88 | 1.88 | 1.88 |
| Inventories | 50.4 | 108.5 | 119.6 | 98.4 | 124.3 | 147.3 | 180.7 | 221.7 | 272.0 | 333.8 |
| Inventories, % | 15.72 | 21.78 | 18.37 | 14.06 | 18.27 | 17.64 | 17.64 | 17.64 | 17.64 | 17.64 |
| Accounts Payable | 24.3 | 33.2 | 24.6 | 28.8 | 51.8 | 49.7 | 61.0 | 74.8 | 91.8 | 112.6 |
| Accounts Payable, % | 7.58 | 6.67 | 3.77 | 4.12 | 7.61 | 5.95 | 5.95 | 5.95 | 5.95 | 5.95 |
| Capital Expenditure | -9.1 | -15.1 | -25.5 | -29.2 | -21.5 | -28.6 | -35.1 | -43.0 | -52.8 | -64.8 |
| Capital Expenditure, % | -2.82 | -3.03 | -3.92 | -4.17 | -3.16 | -3.42 | -3.42 | -3.42 | -3.42 | -3.42 |
| Tax Rate, % | 29.75 | 29.75 | 29.75 | 29.75 | 29.75 | 29.75 | 29.75 | 29.75 | 29.75 | 29.75 |
| EBITAT | 14.8 | 47.7 | 26.6 | 22.6 | 9.6 | 34.5 | 42.3 | 51.9 | 63.6 | 78.1 |
| Depreciation | ||||||||||
| Changes in Account Receivables | ||||||||||
| Changes in Inventories | ||||||||||
| Changes in Accounts Payable | ||||||||||
| Capital Expenditure | ||||||||||
| UFCF | -19.7 | -11.5 | -8.3 | 27.0 | -3.4 | -2.7 | .5 | .6 | .7 | .9 |
| WACC, % | 9.62 | 9.63 | 9.14 | 9.19 | 9.11 | 9.34 | 9.34 | 9.34 | 9.34 | 9.34 |
| PV UFCF | ||||||||||
| SUM PV UFCF | -.5 | |||||||||
| Long Term Growth Rate, % | 3.00 | |||||||||
| Free cash flow (T + 1) | 1 | |||||||||
| Terminal Value | 14 | |||||||||
| Present Terminal Value | 9 | |||||||||
| Enterprise Value | 9 | |||||||||
| Net Debt | 99 | |||||||||
| Equity Value | -91 | |||||||||
| Diluted Shares Outstanding, MM | 17 | |||||||||
| Equity Value Per Share | -5.40 |
What You Will Get
- Real Lovesac Data: Preloaded financials – from revenue to EBIT – based on actual and projected figures.
- Full Customization: Adjust all critical parameters (yellow cells) like WACC, growth %, and tax rates.
- Instant Valuation Updates: Automatic recalculations to analyze the impact of changes on Lovesac’s fair value.
- Versatile Excel Template: Tailored for quick edits, scenario testing, and detailed projections.
- Time-Saving and Accurate: Skip building models from scratch while maintaining precision and flexibility.
Key Features
- Customizable Financial Inputs: Adjust essential metrics such as sales growth, gross margin %, and operating expenses.
- Instant DCF Valuation: Automatically computes intrinsic value, NPV, and additional financial metrics.
- High-Precision Estimations: Incorporates The Lovesac Company's actual financial data for accurate valuation results.
- Effortless Scenario Testing: Explore various assumptions and analyze results with ease.
- Efficiency Booster: Avoid the hassle of creating intricate valuation models from the ground up.
How It Works
- Step 1: Download the Excel file.
- Step 2: Review pre-entered Lovesac data (historical and projected).
- Step 3: Adjust key assumptions (yellow cells) based on your analysis.
- Step 4: View automatic recalculations for Lovesac’s intrinsic value.
- Step 5: Use the outputs for investment decisions or reporting.
Why Choose This Calculator for The Lovesac Company (LOVE)?
- Accuracy: Utilizes real Lovesac financial data to ensure precise calculations.
- Flexibility: Allows users to easily test and adjust inputs as needed.
- Time-Saving: Eliminates the need to construct a DCF model from the ground up.
- Professional-Grade: Crafted with the expertise and usability expected at the CFO level.
- User-Friendly: Intuitive design makes it accessible for users without extensive financial modeling skills.
Who Should Use This Product?
- Investors: Make informed investment choices with a top-tier valuation tool tailored for The Lovesac Company (LOVE).
- Financial Analysts: Streamline your workflow with a customizable DCF model specifically designed for The Lovesac Company (LOVE).
- Consultants: Effortlessly modify the template for engaging client presentations or comprehensive reports about The Lovesac Company (LOVE).
- Finance Enthusiasts: Enhance your knowledge of valuation methods through practical examples related to The Lovesac Company (LOVE).
- Educators and Students: Leverage this tool as a hands-on resource in finance courses focusing on The Lovesac Company (LOVE).
What the Template Contains
- Historical Data: Includes The Lovesac Company's past financials and baseline forecasts.
- DCF and Levered DCF Models: Detailed templates to calculate The Lovesac Company's intrinsic value.
- WACC Sheet: Pre-built calculations for Weighted Average Cost of Capital.
- Editable Inputs: Modify key drivers like growth rates, EBITDA %, and CAPEX assumptions.
- Quarterly and Annual Statements: A complete breakdown of The Lovesac Company's financials.
- Interactive Dashboard: Visualize valuation results and projections dynamically.
Disclaimer
All information, articles, and product details provided on this website are for general informational and educational purposes only. We do not claim any ownership over, nor do we intend to infringe upon, any trademarks, copyrights, logos, brand names, or other intellectual property mentioned or depicted on this site. Such intellectual property remains the property of its respective owners, and any references here are made solely for identification or informational purposes, without implying any affiliation, endorsement, or partnership.
We make no representations or warranties, express or implied, regarding the accuracy, completeness, or suitability of any content or products presented. Nothing on this website should be construed as legal, tax, investment, financial, medical, or other professional advice. In addition, no part of this site—including articles or product references—constitutes a solicitation, recommendation, endorsement, advertisement, or offer to buy or sell any securities, franchises, or other financial instruments, particularly in jurisdictions where such activity would be unlawful.
All content is of a general nature and may not address the specific circumstances of any individual or entity. It is not a substitute for professional advice or services. Any actions you take based on the information provided here are strictly at your own risk. You accept full responsibility for any decisions or outcomes arising from your use of this website and agree to release us from any liability in connection with your use of, or reliance upon, the content or products found herein.