
|
Valoración DCF de Dorian LPG Ltd. (LPG) |
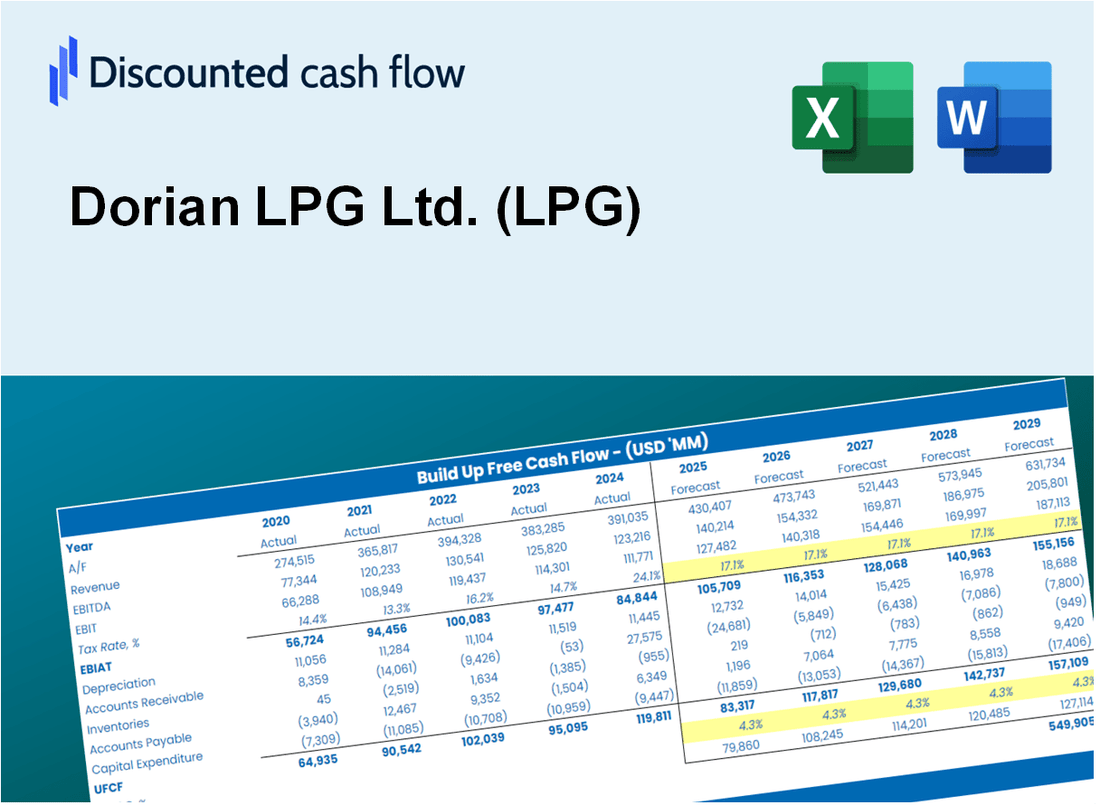
Completamente Editable: Adáptelo A Sus Necesidades En Excel O Sheets
Diseño Profesional: Plantillas Confiables Y Estándares De La Industria
Predeterminadas Para Un Uso Rápido Y Eficiente
Compatible con MAC / PC, completamente desbloqueado
No Se Necesita Experiencia; Fáciles De Seguir
Dorian LPG Ltd. (LPG) Bundle
¡Explore las perspectivas financieras de Dorian LPG Ltd. (GLP) con nuestra calculadora DCF fácil de usar! Ingrese sus proyecciones para el crecimiento, los márgenes de beneficio y los gastos para calcular el valor intrínseco de Dorian LPG Ltd. (GLP) y mejorar su enfoque de inversión.
What You Will Get
- Accurate LPG Financials: Access to historical data and future projections for precise valuation.
- Customizable Inputs: Adjust WACC, tax rates, revenue growth, and capital expenditures to fit your analysis.
- Real-Time Calculations: Dynamic calculations for intrinsic value and NPV at your fingertips.
- Scenario Testing: Evaluate various scenarios to assess Dorian LPG Ltd.'s (LPG) future performance.
- User-Friendly Interface: Designed for industry professionals while remaining approachable for newcomers.
Key Features
- Comprehensive DCF Calculator: Offers detailed unlevered and levered DCF valuation models tailored for Dorian LPG Ltd. (LPG).
- WACC Calculator: Features a pre-built Weighted Average Cost of Capital sheet with adjustable inputs specific to the LPG sector.
- Customizable Forecast Assumptions: Easily adjust growth rates, capital expenditures, and discount rates to fit Dorian LPG Ltd. (LPG) projections.
- Integrated Financial Ratios: Evaluate profitability, leverage, and efficiency ratios relevant to Dorian LPG Ltd. (LPG).
- Interactive Dashboard and Charts: Visual representations summarize essential valuation metrics for straightforward analysis.
How It Works
- 1. Access the Template: Download and open the Excel file containing Dorian LPG Ltd.'s (LPG) financial data.
- 2. Modify Assumptions: Adjust key variables such as growth projections, WACC, and capital expenditures.
- 3. Analyze Results Immediately: The DCF model automatically computes intrinsic value and NPV based on your inputs.
- 4. Explore Scenarios: Evaluate different forecasts to understand various valuation possibilities.
- 5. Present with Assurance: Share professional valuation analyses to back your strategic decisions.
Why Choose This Calculator for Dorian LPG Ltd. (LPG)?
- Comprehensive Tool: Offers DCF, WACC, and financial ratio analyses all in one convenient package.
- Customizable Inputs: Modify yellow-highlighted cells to explore various financial scenarios.
- Detailed Insights: Automatically computes Dorian LPG’s intrinsic value and Net Present Value.
- Preloaded Data: Historical and projected data provide reliable starting points for analysis.
- Professional Quality: Perfect for financial analysts, investors, and business consultants focused on the LPG sector.
Who Should Use Dorian LPG Ltd. (LPG)?
- Maritime Students: Explore shipping industry dynamics and apply theoretical knowledge using real-world data.
- Researchers: Integrate industry-specific models into academic projects or studies.
- Investors: Evaluate your investment strategies and analyze valuation metrics for Dorian LPG Ltd. (LPG).
- Market Analysts: Enhance your analysis with a ready-to-use, customizable financial model tailored for the shipping sector.
- Entrepreneurs: Understand how publicly traded companies like Dorian LPG Ltd. (LPG) are assessed and valued in the market.
What the Template Contains
- Pre-Filled Data: Includes Dorian LPG Ltd.'s historical financials and forecasts.
- Discounted Cash Flow Model: Editable DCF valuation model with automatic calculations.
- Weighted Average Cost of Capital (WACC): A dedicated sheet for calculating WACC based on custom inputs.
- Key Financial Ratios: Analyze Dorian LPG Ltd.'s profitability, efficiency, and leverage.
- Customizable Inputs: Edit revenue growth, margins, and tax rates with ease.
- Clear Dashboard: Charts and tables summarizing key valuation results.
Disclaimer
All information, articles, and product details provided on this website are for general informational and educational purposes only. We do not claim any ownership over, nor do we intend to infringe upon, any trademarks, copyrights, logos, brand names, or other intellectual property mentioned or depicted on this site. Such intellectual property remains the property of its respective owners, and any references here are made solely for identification or informational purposes, without implying any affiliation, endorsement, or partnership.
We make no representations or warranties, express or implied, regarding the accuracy, completeness, or suitability of any content or products presented. Nothing on this website should be construed as legal, tax, investment, financial, medical, or other professional advice. In addition, no part of this site—including articles or product references—constitutes a solicitation, recommendation, endorsement, advertisement, or offer to buy or sell any securities, franchises, or other financial instruments, particularly in jurisdictions where such activity would be unlawful.
All content is of a general nature and may not address the specific circumstances of any individual or entity. It is not a substitute for professional advice or services. Any actions you take based on the information provided here are strictly at your own risk. You accept full responsibility for any decisions or outcomes arising from your use of this website and agree to release us from any liability in connection with your use of, or reliance upon, the content or products found herein.