
|
Valoración DCF de Liquidity Services, Inc. (LQDT) |
Completamente Editable: Adáptelo A Sus Necesidades En Excel O Sheets
Diseño Profesional: Plantillas Confiables Y Estándares De La Industria
Predeterminadas Para Un Uso Rápido Y Eficiente
Compatible con MAC / PC, completamente desbloqueado
No Se Necesita Experiencia; Fáciles De Seguir
Liquidity Services, Inc. (LQDT) Bundle
Ya sea que sea un inversionista o analista, esta calculadora DCF (LQDT) es su recurso para una valoración precisa. Cargados con datos reales de Liquidity Services, Inc., puede ajustar las previsiones y observar instantáneamente los efectos.
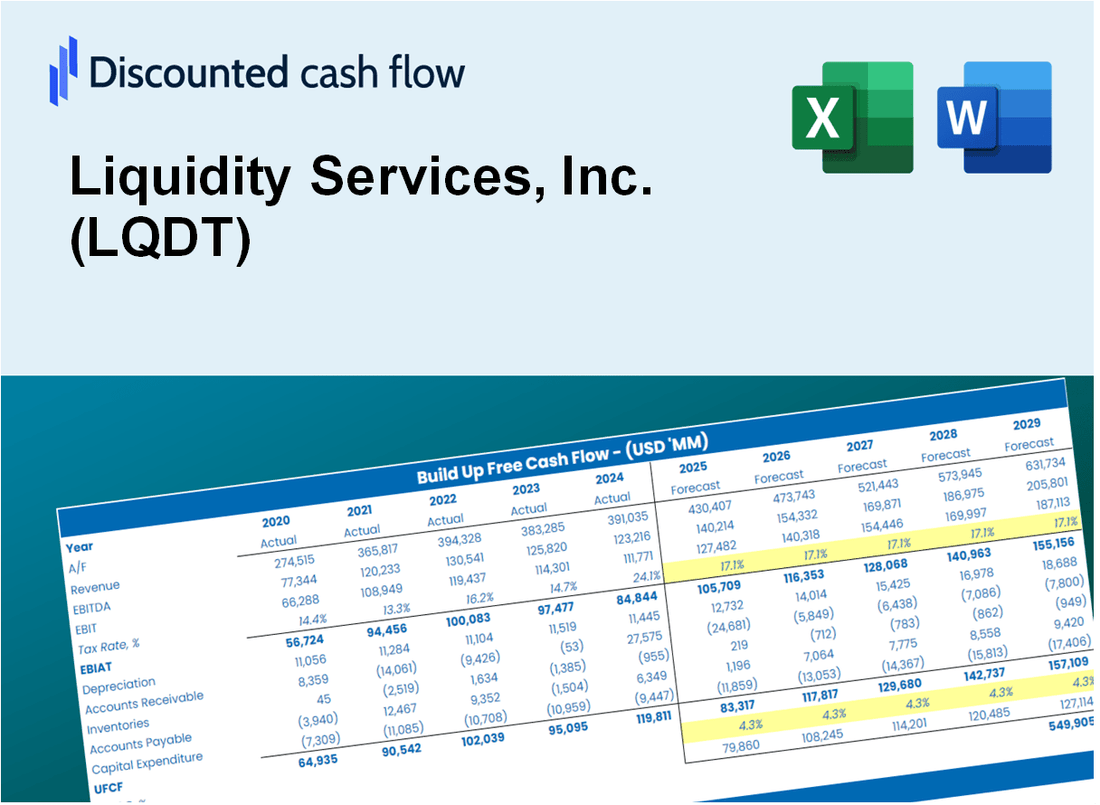
Discounted Cash Flow (DCF) - (USD MM)
| Year | AY1 2020 |
AY2 2021 |
AY3 2022 |
AY4 2023 |
AY5 2024 |
FY1 2025 |
FY2 2026 |
FY3 2027 |
FY4 2028 |
FY5 2029 |
|---|---|---|---|---|---|---|---|---|---|---|
| Revenue | 205.9 | 257.5 | 280.1 | 314.5 | 363.3 | 419.3 | 483.9 | 558.4 | 644.4 | 743.7 |
| Revenue Growth, % | 0 | 25.05 | 8.74 | 12.29 | 15.54 | 15.4 | 15.4 | 15.4 | 15.4 | 15.4 |
| EBITDA | 3.3 | 34.1 | 34.2 | 37.4 | 35.5 | 40.9 | 47.2 | 54.4 | 62.8 | 72.5 |
| EBITDA, % | 1.61 | 13.26 | 12.2 | 11.88 | 9.78 | 9.75 | 9.75 | 9.75 | 9.75 | 9.75 |
| Depreciation | 6.3 | 7.0 | 10.3 | 11.3 | 12.1 | 13.7 | 15.8 | 18.3 | 21.1 | 24.3 |
| Depreciation, % | 3.05 | 2.71 | 3.69 | 3.58 | 3.34 | 3.27 | 3.27 | 3.27 | 3.27 | 3.27 |
| EBIT | -3.0 | 27.2 | 23.8 | 26.1 | 23.4 | 27.1 | 31.3 | 36.1 | 41.7 | 48.1 |
| EBIT, % | -1.44 | 10.55 | 8.52 | 8.3 | 6.44 | 6.47 | 6.47 | 6.47 | 6.47 | 6.47 |
| Total Cash | 76.0 | 106.3 | 97.9 | 118.2 | 155.5 | 162.3 | 187.3 | 216.2 | 249.5 | 287.9 |
| Total Cash, percent | .0 | .0 | .0 | .0 | .0 | .0 | .0 | .0 | .0 | .0 |
| Account Receivables | 5.7 | 6.5 | 12.7 | 8.7 | 13.0 | 13.6 | 15.7 | 18.1 | 20.9 | 24.1 |
| Account Receivables, % | 2.78 | 2.51 | 4.53 | 2.78 | 3.57 | 3.24 | 3.24 | 3.24 | 3.24 | 3.24 |
| Inventories | 5.6 | 12.5 | 11.7 | 11.1 | 17.1 | 16.8 | 19.3 | 22.3 | 25.7 | 29.7 |
| Inventories, % | 2.72 | 4.84 | 4.17 | 3.53 | 4.71 | 4 | 4 | 4 | 4 | 4 |
| Accounts Payable | 22.0 | 40.6 | 42.0 | 39.1 | 58.7 | 58.7 | 67.8 | 78.2 | 90.2 | 104.1 |
| Accounts Payable, % | 10.66 | 15.77 | 14.99 | 12.44 | 16.15 | 14 | 14 | 14 | 14 | 14 |
| Capital Expenditure | -4.2 | -5.5 | -8.1 | -5.4 | -8.9 | -9.4 | -10.9 | -12.6 | -14.5 | -16.7 |
| Capital Expenditure, % | -2.06 | -2.12 | -2.9 | -1.71 | -2.45 | -2.25 | -2.25 | -2.25 | -2.25 | -2.25 |
| Tax Rate, % | 26.67 | 26.67 | 26.67 | 26.67 | 26.67 | 26.67 | 26.67 | 26.67 | 26.67 | 26.67 |
| EBITAT | -3.8 | 50.2 | 20.2 | 18.9 | 17.2 | 23.4 | 27.0 | 31.1 | 35.9 | 41.4 |
| Depreciation | ||||||||||
| Changes in Account Receivables | ||||||||||
| Changes in Inventories | ||||||||||
| Changes in Accounts Payable | ||||||||||
| Capital Expenditure | ||||||||||
| UFCF | 8.9 | 62.8 | 18.3 | 26.4 | 29.7 | 27.4 | 36.3 | 41.9 | 48.3 | 55.8 |
| WACC, % | 9.08 | 9.08 | 9.07 | 9.06 | 9.06 | 9.07 | 9.07 | 9.07 | 9.07 | 9.07 |
| PV UFCF | ||||||||||
| SUM PV UFCF | 158.2 | |||||||||
| Long Term Growth Rate, % | 3.00 | |||||||||
| Free cash flow (T + 1) | 57 | |||||||||
| Terminal Value | 947 | |||||||||
| Present Terminal Value | 613 | |||||||||
| Enterprise Value | 772 | |||||||||
| Net Debt | -139 | |||||||||
| Equity Value | 911 | |||||||||
| Diluted Shares Outstanding, MM | 32 | |||||||||
| Equity Value Per Share | 28.78 |
What You Will Get
- Real Liquidity Services Data: Preloaded financials – from revenue to EBIT – based on actual and projected figures for Liquidity Services, Inc. (LQDT).
- Full Customization: Adjust all critical parameters (yellow cells) like WACC, growth %, and tax rates specific to Liquidity Services, Inc. (LQDT).
- Instant Valuation Updates: Automatic recalculations to analyze the impact of changes on Liquidity Services, Inc.'s (LQDT) fair value.
- Versatile Excel Template: Tailored for quick edits, scenario testing, and detailed projections related to Liquidity Services, Inc. (LQDT).
- Time-Saving and Accurate: Skip building models from scratch while maintaining precision and flexibility for Liquidity Services, Inc. (LQDT).
Key Features
- 🔍 Real-Life LQDT Financials: Pre-filled historical and projected data for Liquidity Services, Inc. (LQDT).
- ✏️ Fully Customizable Inputs: Adjust all critical parameters (yellow cells) like WACC, growth %, and tax rates.
- 📊 Professional DCF Valuation: Built-in formulas calculate Liquidity Services’ intrinsic value using the Discounted Cash Flow method.
- ⚡ Instant Results: Visualize Liquidity Services’ valuation instantly after making changes.
- Scenario Analysis: Test and compare outcomes for various financial assumptions side-by-side.
How It Works
- Download: Obtain the pre-formatted Excel file featuring Liquidity Services, Inc.'s (LQDT) financial metrics.
- Customize: Modify projections such as revenue growth, EBITDA %, and WACC to suit your analysis.
- Update Automatically: The intrinsic value and NPV calculations refresh in real-time as you make changes.
- Test Scenarios: Develop various forecasts and evaluate different outcomes on the spot.
- Make Decisions: Leverage the valuation findings to inform your investment choices.
Why Choose This Calculator for Liquidity Services, Inc. (LQDT)?
- Comprehensive Tool: Offers DCF, WACC, and financial ratio analyses all in one convenient package.
- Customizable Inputs: Modify the yellow-highlighted cells to explore different financial scenarios.
- Detailed Insights: Automatically computes Liquidity Services’ intrinsic value and Net Present Value.
- Preloaded Data: Access to historical and projected data provides reliable starting points for analysis.
- Professional Quality: Perfect for financial analysts, investors, and business consultants focused on LQDT.
Who Should Use This Product?
- Investors: Assess Liquidity Services, Inc.'s (LQDT) market performance before making investment decisions.
- CFOs and Financial Analysts: Enhance valuation methodologies and validate financial forecasts.
- Startup Founders: Understand the valuation strategies employed by successful companies like Liquidity Services, Inc. (LQDT).
- Consultants: Provide comprehensive valuation analyses and reports for client projects.
- Students and Educators: Utilize current market data to learn and teach valuation principles.
What the Template Contains
- Historical Data: Includes Liquidity Services, Inc.’s (LQDT) past financials and baseline forecasts.
- DCF and Levered DCF Models: Detailed templates to calculate Liquidity Services, Inc.’s (LQDT) intrinsic value.
- WACC Sheet: Pre-built calculations for Weighted Average Cost of Capital.
- Editable Inputs: Modify key drivers like growth rates, EBITDA %, and CAPEX assumptions.
- Quarterly and Annual Statements: A complete breakdown of Liquidity Services, Inc.’s (LQDT) financials.
- Interactive Dashboard: Visualize valuation results and projections dynamically.
Disclaimer
All information, articles, and product details provided on this website are for general informational and educational purposes only. We do not claim any ownership over, nor do we intend to infringe upon, any trademarks, copyrights, logos, brand names, or other intellectual property mentioned or depicted on this site. Such intellectual property remains the property of its respective owners, and any references here are made solely for identification or informational purposes, without implying any affiliation, endorsement, or partnership.
We make no representations or warranties, express or implied, regarding the accuracy, completeness, or suitability of any content or products presented. Nothing on this website should be construed as legal, tax, investment, financial, medical, or other professional advice. In addition, no part of this site—including articles or product references—constitutes a solicitation, recommendation, endorsement, advertisement, or offer to buy or sell any securities, franchises, or other financial instruments, particularly in jurisdictions where such activity would be unlawful.
All content is of a general nature and may not address the specific circumstances of any individual or entity. It is not a substitute for professional advice or services. Any actions you take based on the information provided here are strictly at your own risk. You accept full responsibility for any decisions or outcomes arising from your use of this website and agree to release us from any liability in connection with your use of, or reliance upon, the content or products found herein.