
|
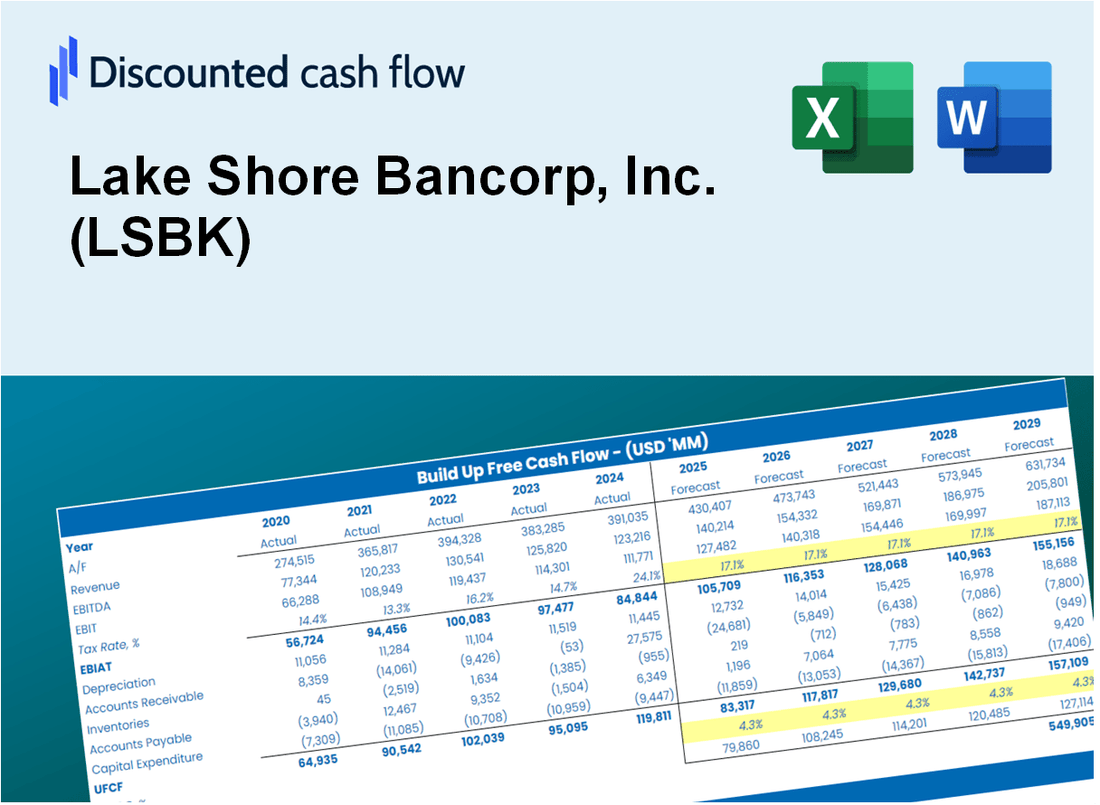
Valoración DCF de Lake Shore Bancorp, Inc. (LSBK) |
Completamente Editable: Adáptelo A Sus Necesidades En Excel O Sheets
Diseño Profesional: Plantillas Confiables Y Estándares De La Industria
Predeterminadas Para Un Uso Rápido Y Eficiente
Compatible con MAC / PC, completamente desbloqueado
No Se Necesita Experiencia; Fáciles De Seguir
Lake Shore Bancorp, Inc. (LSBK) Bundle
¡Obtenga dominio sobre su análisis de valoración de Lake Shore Bancorp, Inc. (LSBK) con nuestra sofisticada calculadora DCF! Precedido con datos reales (LSBK), esta plantilla de Excel le permite ajustar los pronósticos y supuestos para determinar con precisión el valor intrínseco de Lake Shore Bancorp, Inc.
What You Will Get
- Real LSBK Financials: Access to historical and projected data for precise valuation.
- Customizable Inputs: Adjust WACC, tax rates, revenue growth, and capital expenditures as needed.
- Dynamic Calculations: Intrinsic value and NPV are computed in real-time.
- Scenario Analysis: Evaluate various scenarios to assess Lake Shore Bancorp’s future performance.
- User-Friendly Design: Tailored for professionals while remaining accessible for newcomers.
Key Features
- Comprehensive Financial Data: Lake Shore Bancorp, Inc.'s historical financial statements and pre-filled projections.
- Customizable Parameters: Adjust WACC, tax rates, revenue growth, and EBITDA margins to fit your analysis.
- Real-Time Valuation: Instantly view Lake Shore Bancorp, Inc.'s intrinsic value as it updates live.
- Intuitive Visualizations: Dashboard charts clearly present valuation results and essential metrics.
- Designed for Precision: A reliable tool tailored for analysts, investors, and finance professionals.
How It Works
- Download the Template: Gain immediate access to the Excel-based LSBK DCF Calculator.
- Input Your Assumptions: Modify the yellow-highlighted cells for growth rates, WACC, margins, and other variables.
- Instant Calculations: The model automatically recalculates Lake Shore Bancorp's intrinsic value.
- Test Scenarios: Experiment with various assumptions to assess potential valuation shifts.
- Analyze and Decide: Utilize the outcomes to inform your investment or financial analysis.
Why Choose This Calculator for Lake Shore Bancorp, Inc. (LSBK)?
- User-Friendly Interface: Crafted for both novices and seasoned professionals.
- Customizable Inputs: Adjust parameters effortlessly to suit your financial analysis.
- Real-Time Valuation: Observe immediate updates to Lake Shore Bancorp’s valuation as you change inputs.
- Preloaded Data: Comes with Lake Shore Bancorp’s actual financial metrics for swift evaluation.
- Relied Upon by Experts: Favored by investors and analysts for making well-informed choices.
Who Should Use Lake Shore Bancorp, Inc. (LSBK)?
- Finance Students: Explore banking fundamentals and apply them using real-world financial data.
- Academics: Integrate industry-specific models into your curriculum or research projects.
- Investors: Evaluate your investment strategies and assess the financial health of Lake Shore Bancorp, Inc. (LSBK).
- Analysts: Enhance your analysis with a customizable financial model tailored for banking institutions.
- Small Business Owners: Understand the financial metrics that drive the performance of publicly traded banks like Lake Shore Bancorp, Inc. (LSBK).
What the Template Contains
- Pre-Filled Data: Includes Lake Shore Bancorp, Inc.'s (LSBK) historical financials and forecasts.
- Discounted Cash Flow Model: Editable DCF valuation model with automatic calculations.
- Weighted Average Cost of Capital (WACC): A dedicated sheet for calculating WACC based on custom inputs.
- Key Financial Ratios: Analyze Lake Shore Bancorp, Inc.'s (LSBK) profitability, efficiency, and leverage.
- Customizable Inputs: Edit revenue growth, margins, and tax rates with ease.
- Clear Dashboard: Charts and tables summarizing key valuation results.
Disclaimer
All information, articles, and product details provided on this website are for general informational and educational purposes only. We do not claim any ownership over, nor do we intend to infringe upon, any trademarks, copyrights, logos, brand names, or other intellectual property mentioned or depicted on this site. Such intellectual property remains the property of its respective owners, and any references here are made solely for identification or informational purposes, without implying any affiliation, endorsement, or partnership.
We make no representations or warranties, express or implied, regarding the accuracy, completeness, or suitability of any content or products presented. Nothing on this website should be construed as legal, tax, investment, financial, medical, or other professional advice. In addition, no part of this site—including articles or product references—constitutes a solicitation, recommendation, endorsement, advertisement, or offer to buy or sell any securities, franchises, or other financial instruments, particularly in jurisdictions where such activity would be unlawful.
All content is of a general nature and may not address the specific circumstances of any individual or entity. It is not a substitute for professional advice or services. Any actions you take based on the information provided here are strictly at your own risk. You accept full responsibility for any decisions or outcomes arising from your use of this website and agree to release us from any liability in connection with your use of, or reliance upon, the content or products found herein.