
|
Mahindra & Mahindra Financial Services Limited (M & mfin.ns) Valoración de DCF |
Completamente Editable: Adáptelo A Sus Necesidades En Excel O Sheets
Diseño Profesional: Plantillas Confiables Y Estándares De La Industria
Predeterminadas Para Un Uso Rápido Y Eficiente
Compatible con MAC / PC, completamente desbloqueado
No Se Necesita Experiencia; Fáciles De Seguir
Mahindra & Mahindra Limited (M&MFIN.NS) Bundle
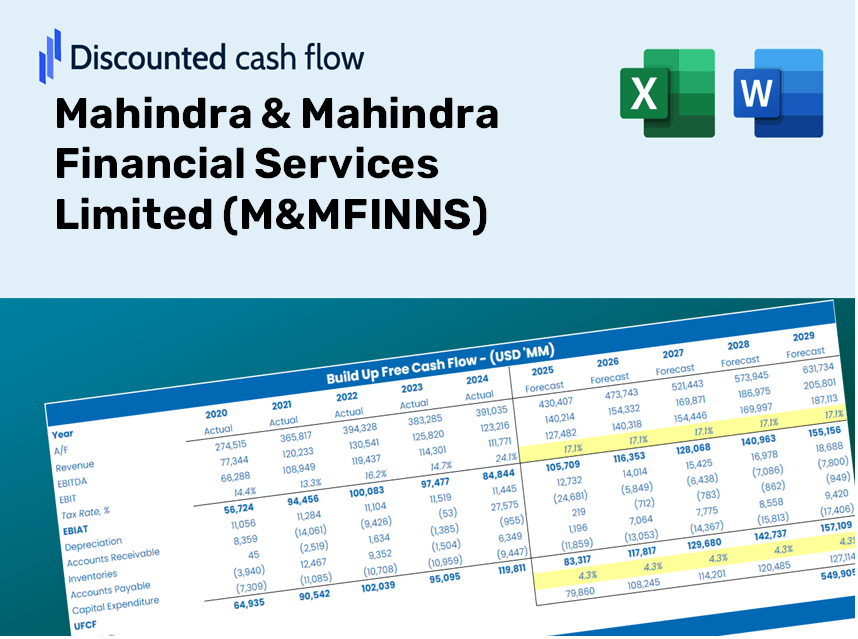
Evaluar las perspectivas financieras para Mahindra & Mahindra Financial Services Limited (M & Mfinns) ¡Como un experto! Esta calculadora DCF (M & Mfinns) ofrece datos financieros prejuguados, al tiempo que le permite la libertad de modificar el crecimiento de los ingresos, WACC, los márgenes y otros supuestos esenciales para alinearse con sus proyecciones.
Discounted Cash Flow (DCF) - (USD MM)
| Year | AY1 2020 |
AY2 2021 |
AY3 2022 |
AY4 2023 |
AY5 2024 |
FY1 2025 |
FY2 2026 |
FY3 2027 |
FY4 2028 |
FY5 2029 |
|---|---|---|---|---|---|---|---|---|---|---|
| Revenue | 18,097.0 | 25,399.0 | 25,449.0 | 23,866.0 | 23,006.0 | 24,773.0 | 26,675.7 | 28,724.6 | 30,930.8 | 33,306.4 |
| Revenue Growth, % | 0 | 40.35 | 0.19686 | -6.22 | -3.6 | 7.68 | 7.68 | 7.68 | 7.68 | 7.68 |
| EBITDA | -3,543.0 | 2,999.0 | 2,496.0 | 1,075.0 | 1,759.0 | 702.9 | 756.9 | 815.1 | 877.7 | 945.1 |
| EBITDA, % | -19.58 | 11.81 | 9.81 | 4.5 | 7.65 | 2.84 | 2.84 | 2.84 | 2.84 | 2.84 |
| Depreciation | 959.0 | 874.0 | 857.0 | 897.0 | 881.0 | 975.8 | 1,050.8 | 1,131.5 | 1,218.4 | 1,312.0 |
| Depreciation, % | 5.3 | 3.44 | 3.37 | 3.76 | 3.83 | 3.94 | 3.94 | 3.94 | 3.94 | 3.94 |
| EBIT | -4,502.0 | 2,125.0 | 1,639.0 | 178.0 | 878.0 | -272.9 | -293.9 | -316.4 | -340.7 | -366.9 |
| EBIT, % | -24.88 | 8.37 | 6.44 | 0.74583 | 3.82 | -1.1 | -1.1 | -1.1 | -1.1 | -1.1 |
| Total Cash | 1,679.0 | 1,712.0 | 862.0 | 1,034.0 | 1,306.0 | 1,457.4 | 1,569.3 | 1,689.8 | 1,819.6 | 1,959.4 |
| Total Cash, percent | .0 | .0 | .0 | .0 | .0 | .0 | .0 | .0 | .0 | .0 |
| Account Receivables | 276.0 | 297.0 | 300.0 | 293.0 | 303.0 | 318.0 | 342.4 | 368.7 | 397.0 | 427.5 |
| Account Receivables, % | 1.53 | 1.17 | 1.18 | 1.23 | 1.32 | 1.28 | 1.28 | 1.28 | 1.28 | 1.28 |
| Inventories | 3,774.0 | 4,383.0 | 4,267.0 | 4,361.0 | 4,468.0 | 4,586.6 | 4,938.8 | 5,318.2 | 5,726.6 | 6,166.5 |
| Inventories, % | 20.85 | 17.26 | 16.77 | 18.27 | 19.42 | 18.51 | 18.51 | 18.51 | 18.51 | 18.51 |
| Accounts Payable | 2,856.0 | 3,280.0 | 2,874.0 | 2,523.0 | 2,746.0 | 3,096.4 | 3,334.3 | 3,590.4 | 3,866.1 | 4,163.1 |
| Accounts Payable, % | 15.78 | 12.91 | 11.29 | 10.57 | 11.94 | 12.5 | 12.5 | 12.5 | 12.5 | 12.5 |
| Capital Expenditure | -466.0 | -597.0 | -1,295.0 | -993.0 | -518.0 | -813.9 | -876.4 | -943.7 | -1,016.2 | -1,094.2 |
| Capital Expenditure, % | -2.58 | -2.35 | -5.09 | -4.16 | -2.25 | -3.29 | -3.29 | -3.29 | -3.29 | -3.29 |
| Tax Rate, % | 23.72 | 23.72 | 23.72 | 23.72 | 23.72 | 23.72 | 23.72 | 23.72 | 23.72 | 23.72 |
| EBITAT | -3,706.9 | 1,628.5 | 1,271.7 | 186.3 | 669.7 | -225.3 | -242.6 | -261.3 | -281.3 | -302.9 |
| Depreciation | ||||||||||
| Changes in Account Receivables | ||||||||||
| Changes in Inventories | ||||||||||
| Changes in Accounts Payable | ||||||||||
| Capital Expenditure | ||||||||||
| UFCF | -4,407.9 | 1,699.5 | 540.7 | -347.7 | 1,138.7 | 153.6 | -207.1 | -223.0 | -240.1 | -258.6 |
| WACC, % | 7.26 | 7.15 | 7.17 | 7.62 | 7.14 | 7.27 | 7.27 | 7.27 | 7.27 | 7.27 |
| PV UFCF | ||||||||||
| SUM PV UFCF | -580.9 | |||||||||
| Long Term Growth Rate, % | 0.50 | |||||||||
| Free cash flow (T + 1) | -260 | |||||||||
| Terminal Value | -3,840 | |||||||||
| Present Terminal Value | -2,704 | |||||||||
| Enterprise Value | -3,285 | |||||||||
| Net Debt | 4,767 | |||||||||
| Equity Value | -8,052 | |||||||||
| Diluted Shares Outstanding, MM | 282 | |||||||||
| Equity Value Per Share | -28.59 |
What You Will Receive
- Authentic M&MFINNS Financial Data: Pre-loaded with Mahindra & Mahindra Financial Services Limited’s historical and projected data for accurate analysis.
- Fully Customizable Template: Easily adjust key metrics such as revenue growth, WACC, and EBITDA percentage.
- Instant Calculations: Watch M&MFINNS’s intrinsic value update in real-time as you make adjustments.
- Expert Valuation Tool: Crafted for investors, analysts, and consultants seeking reliable DCF outcomes.
- Intuitive Design: Straightforward layout and clear guidance suitable for all skill levels.
Key Features of Mahindra & Mahindra Financial Services Limited (M&MFINNS)
- Customizable Financial Inputs: Adjust essential metrics such as loan growth, profit margins, and operational expenses.
- Instant DCF Valuation: Quickly computes intrinsic value, net present value, and additional financial metrics.
- High-Precision Results: Leverages Mahindra & Mahindra’s actual financial data for accurate valuation assessments.
- Streamlined Scenario Testing: Easily evaluate various assumptions and analyze the resulting impacts.
- Efficiency Booster: Eliminate the hassle of constructing intricate valuation models from the ground up.
How It Works
- Download the Template: Gain immediate access to the Excel-based M&MFINNS DCF Calculator.
- Input Your Assumptions: Modify the yellow-highlighted cells for growth rates, WACC, margins, and additional parameters.
- Instant Calculations: The model automatically computes the intrinsic value of Mahindra & Mahindra Financial Services Limited (M&MFINNS).
- Test Scenarios: Experiment with various assumptions to assess potential changes in valuation.
- Analyze and Decide: Leverage the results to inform your investment or financial analysis.
Why Opt for This Calculator?
- Designed for Experts: A sophisticated tool utilized by analysts, CFOs, and financial consultants.
- Accurate Financial Data: M&MFINNS's historical and projected financials are preloaded for precise analysis.
- Flexible Scenario Analysis: Effortlessly simulate various forecasts and underlying assumptions.
- Comprehensive Results: Instantly calculates intrinsic value, NPV, and essential financial metrics.
- User-Friendly Interface: Step-by-step guidance to simplify your experience.
Who Can Benefit from M&MFINNS?
- Investors: Gain confidence in your investment choices with our advanced valuation tools.
- Financial Analysts: Streamline your work with our customizable DCF model designed for efficiency.
- Consultants: Effortlessly modify the template for engaging client presentations or comprehensive reports.
- Finance Enthusiasts: Enhance your grasp of valuation techniques through practical, real-world examples.
- Educators and Students: Utilize our resources as effective learning aids in finance-related courses.
Contents of the Template
- Pre-Filled Data: Features M&MFINNS's historical financial statements and projections.
- Discounted Cash Flow Model: An editable DCF valuation model with automatic calculation capabilities.
- Weighted Average Cost of Capital (WACC): A specific sheet for WACC calculations based on tailored inputs.
- Key Financial Ratios: Evaluate M&MFINNS's profitability, efficiency, and leverage metrics.
- Customizable Inputs: Easily adjust revenue growth trends, margins, and tax rates.
- User-Friendly Dashboard: Visual representations and tables summarizing essential valuation outcomes.
Disclaimer
All information, articles, and product details provided on this website are for general informational and educational purposes only. We do not claim any ownership over, nor do we intend to infringe upon, any trademarks, copyrights, logos, brand names, or other intellectual property mentioned or depicted on this site. Such intellectual property remains the property of its respective owners, and any references here are made solely for identification or informational purposes, without implying any affiliation, endorsement, or partnership.
We make no representations or warranties, express or implied, regarding the accuracy, completeness, or suitability of any content or products presented. Nothing on this website should be construed as legal, tax, investment, financial, medical, or other professional advice. In addition, no part of this site—including articles or product references—constitutes a solicitation, recommendation, endorsement, advertisement, or offer to buy or sell any securities, franchises, or other financial instruments, particularly in jurisdictions where such activity would be unlawful.
All content is of a general nature and may not address the specific circumstances of any individual or entity. It is not a substitute for professional advice or services. Any actions you take based on the information provided here are strictly at your own risk. You accept full responsibility for any decisions or outcomes arising from your use of this website and agree to release us from any liability in connection with your use of, or reliance upon, the content or products found herein.