
|
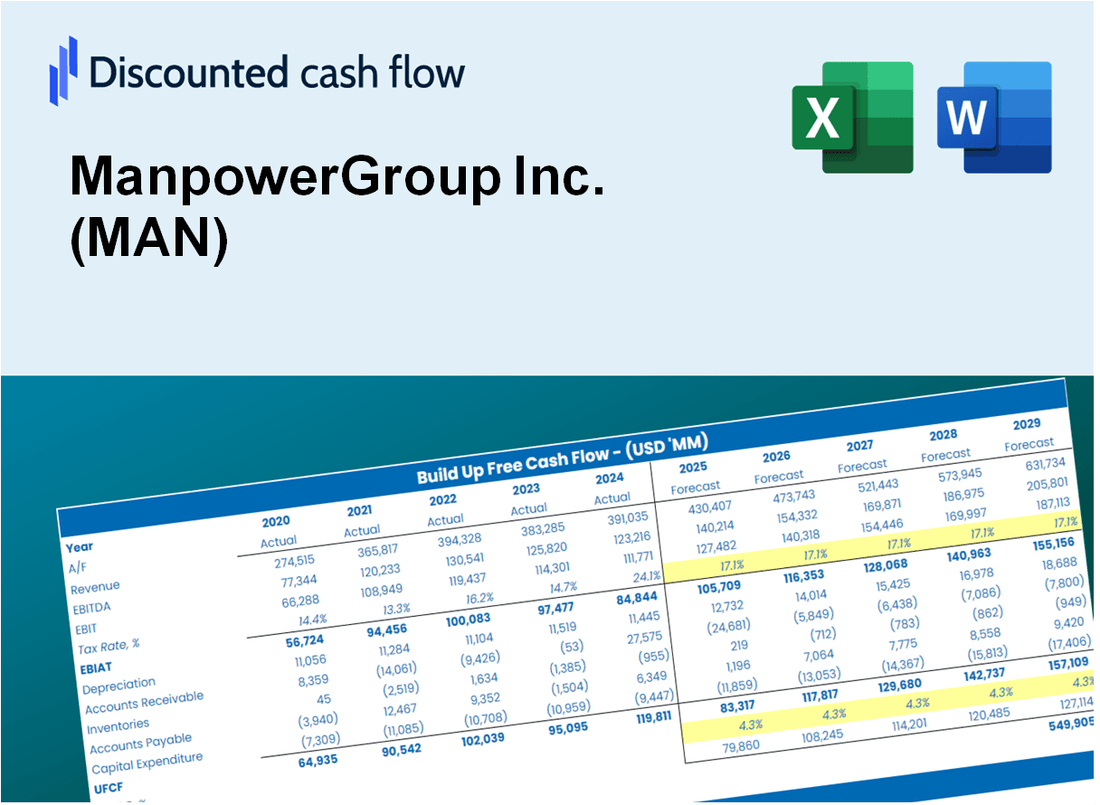
Valoración DCF de ManpowerGroup Inc. (MAN) |
Completamente Editable: Adáptelo A Sus Necesidades En Excel O Sheets
Diseño Profesional: Plantillas Confiables Y Estándares De La Industria
Predeterminadas Para Un Uso Rápido Y Eficiente
Compatible con MAC / PC, completamente desbloqueado
No Se Necesita Experiencia; Fáciles De Seguir
ManpowerGroup Inc. (MAN) Bundle
Diseñada para la precisión, nuestra calculadora DCF (man) le permite evaluar la valoración de ManpowerGroup Inc. utilizando ideas financieras del mundo real y una flexibilidad completa para modificar todos los parámetros esenciales para mejorar las proyecciones.
What You Will Get
- Real MAN Financial Data: Pre-filled with ManpowerGroup’s historical and projected data for precise analysis.
- Fully Editable Template: Modify key inputs like revenue growth, WACC, and EBITDA % with ease.
- Automatic Calculations: See ManpowerGroup’s intrinsic value update instantly based on your changes.
- Professional Valuation Tool: Designed for investors, analysts, and consultants seeking accurate DCF results.
- User-Friendly Design: Simple structure and clear instructions for all experience levels.
Key Features
- Comprehensive Workforce Data: Access reliable pre-loaded historical metrics and future workforce trends.
- Adjustable Workforce Assumptions: Modify highlighted cells for factors like turnover rates, hiring costs, and productivity metrics.
- Real-Time Analytics: Instant updates to workforce projections, cost analyses, and efficiency assessments.
- Interactive Dashboard: User-friendly charts and summaries to visualize your workforce planning results.
- Suitable for All Levels: An intuitive layout designed for HR professionals, business leaders, and consultants.
How It Works
- Step 1: Download the Excel file.
- Step 2: Review pre-entered ManpowerGroup Inc. (MAN) data (historical and projected).
- Step 3: Adjust key assumptions (yellow cells) based on your analysis.
- Step 4: View automatic recalculations for ManpowerGroup Inc. (MAN)’s intrinsic value.
- Step 5: Use the outputs for investment decisions or reporting.
Why Choose This Calculator for ManpowerGroup Inc. (MAN)?
- User-Friendly Interface: Tailored for both novices and seasoned professionals.
- Customizable Inputs: Adjust parameters easily to suit your specific analysis.
- Real-Time Updates: Monitor immediate changes to ManpowerGroup’s valuation as you modify inputs.
- Preloaded Data: Comes with ManpowerGroup’s actual financial information for swift evaluations.
- Relied Upon by Experts: Utilized by analysts and investors for well-informed decision-making.
Who Should Use This Product?
- Investors: Assess the fair value of ManpowerGroup Inc. (MAN) to inform your investment choices.
- CFOs: Utilize a high-quality DCF model for accurate financial reporting and analysis.
- Consultants: Effortlessly customize the template for client valuation reports.
- Entrepreneurs: Discover financial modeling techniques employed by leading firms.
- Educators: Employ it as a resource to illustrate valuation methods in the classroom.
What the Template Contains
- Pre-Filled DCF Model: ManpowerGroup Inc.’s (MAN) financial data preloaded for immediate use.
- WACC Calculator: Detailed calculations for Weighted Average Cost of Capital.
- Financial Ratios: Evaluate ManpowerGroup Inc.’s (MAN) profitability, leverage, and efficiency.
- Editable Inputs: Change assumptions such as growth, margins, and CAPEX to fit your scenarios.
- Financial Statements: Annual and quarterly reports to support detailed analysis.
- Interactive Dashboard: Easily visualize key valuation metrics and results.
Disclaimer
All information, articles, and product details provided on this website are for general informational and educational purposes only. We do not claim any ownership over, nor do we intend to infringe upon, any trademarks, copyrights, logos, brand names, or other intellectual property mentioned or depicted on this site. Such intellectual property remains the property of its respective owners, and any references here are made solely for identification or informational purposes, without implying any affiliation, endorsement, or partnership.
We make no representations or warranties, express or implied, regarding the accuracy, completeness, or suitability of any content or products presented. Nothing on this website should be construed as legal, tax, investment, financial, medical, or other professional advice. In addition, no part of this site—including articles or product references—constitutes a solicitation, recommendation, endorsement, advertisement, or offer to buy or sell any securities, franchises, or other financial instruments, particularly in jurisdictions where such activity would be unlawful.
All content is of a general nature and may not address the specific circumstances of any individual or entity. It is not a substitute for professional advice or services. Any actions you take based on the information provided here are strictly at your own risk. You accept full responsibility for any decisions or outcomes arising from your use of this website and agree to release us from any liability in connection with your use of, or reliance upon, the content or products found herein.