
|
Valoración de DCF Mankind Pharma Limited (Mankind.NS) |
Completamente Editable: Adáptelo A Sus Necesidades En Excel O Sheets
Diseño Profesional: Plantillas Confiables Y Estándares De La Industria
Predeterminadas Para Un Uso Rápido Y Eficiente
Compatible con MAC / PC, completamente desbloqueado
No Se Necesita Experiencia; Fáciles De Seguir
Mankind Pharma Limited (MANKIND.NS) Bundle
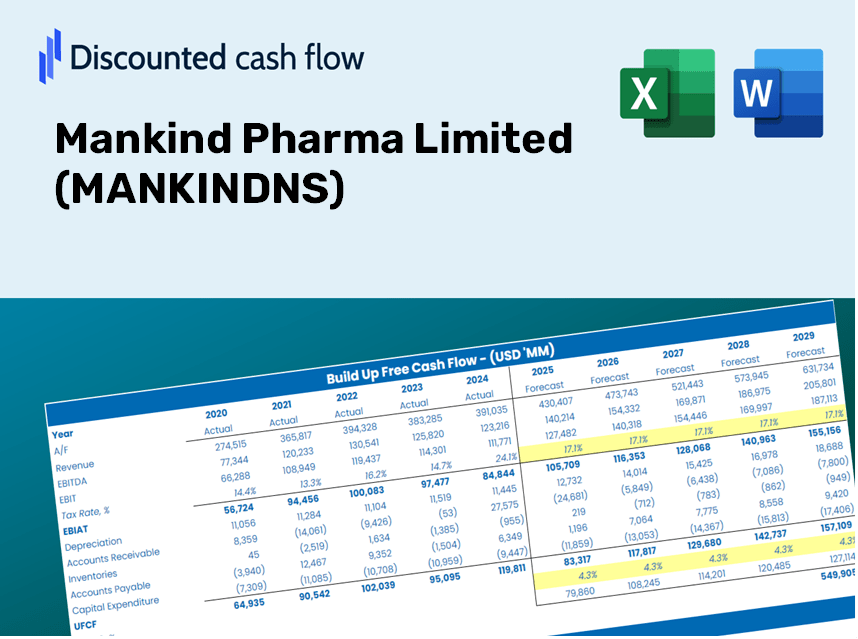
Diseñada para la precisión, nuestra calculadora DCF (Mankindns) le permite evaluar la valoración de la humanidad Pharma Limited utilizando datos financieros del mundo real y ofrece una flexibilidad completa para modificar todos los parámetros esenciales para mejorar las proyecciones.
Discounted Cash Flow (DCF) - (USD MM)
| Year | AY1 2021 |
AY2 2022 |
AY3 2023 |
AY4 2024 |
AY5 2025 |
FY1 2026 |
FY2 2027 |
FY3 2028 |
FY4 2029 |
FY5 2030 |
|---|---|---|---|---|---|---|---|---|---|---|
| Revenue | 62,144.3 | 77,815.6 | 87,428.5 | 103,347.7 | 122,074.4 | 144,627.4 | 171,347.1 | 203,003.2 | 240,507.7 | 284,941.2 |
| Revenue Growth, % | 0 | 25.22 | 12.35 | 18.21 | 18.12 | 18.47 | 18.47 | 18.47 | 18.47 | 18.47 |
| EBITDA | 18,165.7 | 21,469.5 | 20,266.7 | 28,094.7 | 30,179.3 | 38,155.4 | 45,204.5 | 53,556.0 | 63,450.3 | 75,172.7 |
| EBITDA, % | 29.23 | 27.59 | 23.18 | 27.18 | 24.72 | 26.38 | 26.38 | 26.38 | 26.38 | 26.38 |
| Depreciation | 1,189.2 | 1,665.7 | 3,258.6 | 3,982.0 | 6,212.2 | 4,837.2 | 5,730.9 | 6,789.7 | 8,044.1 | 9,530.2 |
| Depreciation, % | 1.91 | 2.14 | 3.73 | 3.85 | 5.09 | 3.34 | 3.34 | 3.34 | 3.34 | 3.34 |
| EBIT | 16,976.5 | 19,803.8 | 17,008.0 | 24,112.7 | 23,967.1 | 33,318.1 | 39,473.6 | 46,766.3 | 55,406.2 | 65,642.5 |
| EBIT, % | 27.32 | 25.45 | 19.45 | 23.33 | 19.63 | 23.04 | 23.04 | 23.04 | 23.04 | 23.04 |
| Total Cash | 20,044.8 | 12,793.1 | 15,286.7 | 34,560.8 | 22,453.4 | 34,136.4 | 40,443.0 | 47,914.8 | 56,767.0 | 67,254.6 |
| Total Cash, percent | .0 | .0 | .0 | .0 | .0 | .0 | .0 | .0 | .0 | .0 |
| Account Receivables | 4,242.1 | 4,267.2 | 6,058.1 | 8,482.8 | 15,383.4 | 11,584.3 | 13,724.5 | 16,260.1 | 19,264.1 | 22,823.1 |
| Account Receivables, % | 6.83 | 5.48 | 6.93 | 8.21 | 12.6 | 8.01 | 8.01 | 8.01 | 8.01 | 8.01 |
| Inventories | 11,835.4 | 17,602.4 | 14,984.6 | 15,534.6 | 20,937.1 | 26,318.6 | 31,180.9 | 36,941.5 | 43,766.3 | 51,852.1 |
| Inventories, % | 19.05 | 22.62 | 17.14 | 15.03 | 17.15 | 18.2 | 18.2 | 18.2 | 18.2 | 18.2 |
| Accounts Payable | 7,059.2 | 10,869.4 | 10,081.8 | 11,029.9 | 11,334.0 | 16,434.3 | 19,470.5 | 23,067.7 | 27,329.4 | 32,378.5 |
| Accounts Payable, % | 11.36 | 13.97 | 11.53 | 10.67 | 9.28 | 11.36 | 11.36 | 11.36 | 11.36 | 11.36 |
| Capital Expenditure | -3,123.2 | -23,455.2 | -8,320.7 | -3,823.4 | -4,607.9 | -15,087.3 | -17,874.6 | -21,176.9 | -25,089.3 | -29,724.5 |
| Capital Expenditure, % | -5.03 | -30.14 | -9.52 | -3.7 | -3.77 | -10.43 | -10.43 | -10.43 | -10.43 | -10.43 |
| Tax Rate, % | 20.88 | 20.88 | 20.88 | 20.88 | 20.88 | 20.88 | 20.88 | 20.88 | 20.88 | 20.88 |
| EBITAT | 12,699.4 | 14,376.7 | 13,045.3 | 19,223.9 | 18,963.1 | 25,518.3 | 30,232.8 | 35,818.3 | 42,435.6 | 50,275.5 |
| Depreciation | ||||||||||
| Changes in Account Receivables | ||||||||||
| Changes in Inventories | ||||||||||
| Changes in Accounts Payable | ||||||||||
| Capital Expenditure | ||||||||||
| UFCF | 1,747.2 | -9,394.7 | 8,022.5 | 17,356.0 | 8,568.5 | 18,786.3 | 14,122.8 | 16,732.0 | 19,823.2 | 23,485.5 |
| WACC, % | 4.84 | 4.83 | 4.84 | 4.86 | 4.85 | 4.84 | 4.84 | 4.84 | 4.84 | 4.84 |
| PV UFCF | ||||||||||
| SUM PV UFCF | 80,228.5 | |||||||||
| Long Term Growth Rate, % | 2.00 | |||||||||
| Free cash flow (T + 1) | 23,955 | |||||||||
| Terminal Value | 842,197 | |||||||||
| Present Terminal Value | 664,796 | |||||||||
| Enterprise Value | 745,024 | |||||||||
| Net Debt | 79,570 | |||||||||
| Equity Value | 665,455 | |||||||||
| Diluted Shares Outstanding, MM | 405 | |||||||||
| Equity Value Per Share | 1,644.45 |
What You Will Receive
- Genuine MANKIND Financials: Comprehensive historical and projected data for precise valuation.
- Customizable Parameters: Adjust WACC, tax rates, revenue growth, and capital investments as needed.
- Instant Calculations: Dynamic computation of intrinsic value and NPV.
- Scenario Evaluation: Explore various scenarios to assess Mankind Pharma Limited's future performance.
- Clear and User-Friendly Interface: Designed for professionals while remaining accessible to novices.
Key Features
- Advanced DCF Calculator: Offers comprehensive unlevered and levered DCF valuation models tailored for Mankind Pharma Limited.
- WACC Calculator: Features a pre-designed Weighted Average Cost of Capital sheet with customizable input options.
- Editable Forecast Assumptions: Enables adjustments to growth rates, capital expenses, and discount rates.
- Built-In Financial Ratios: Evaluate profitability, leverage, and efficiency ratios specific to Mankind Pharma Limited (MANKINDNS).
- Dashboard and Charts: Provides visual summaries of essential valuation metrics for straightforward analysis.
How It Works
- Download: Obtain the ready-to-use Excel file featuring Mankind Pharma Limited's (MANKINDNS) financial data.
- Customize: Tailor your forecasts, including revenue growth, EBITDA %, and WACC.
- Update Automatically: Watch as the intrinsic value and NPV calculations update in real-time.
- Test Scenarios: Generate multiple projections and instantly compare results.
- Make Decisions: Leverage the valuation outcomes to inform your investment strategy.
Why Use This Calculator?
- All-in-One Solution: Features DCF, WACC, and financial ratio analyses tailored for Mankind Pharma Limited (MANKINDNS).
- Flexible Inputs: Modify the highlighted cells to explore different financial scenarios.
- In-Depth Analysis: Automatically computes Mankind Pharma's intrinsic value and Net Present Value.
- Preloaded Information: Access historical and projected data for accurate baseline assessments.
- Expert-Level Quality: Perfect for financial analysts, investors, and business advisors focused on Mankind Pharma Limited (MANKINDNS).
Who Should Use This Product?
- Individual Investors: Make informed decisions about buying or selling Mankind Pharma Limited (MANKINDNS) stock.
- Financial Analysts: Enhance valuation processes with readily available financial models specific to Mankind Pharma Limited (MANKINDNS).
- Consultants: Provide clients with timely and precise valuation insights regarding Mankind Pharma Limited (MANKINDNS).
- Business Owners: Gain insight into the valuation of major companies like Mankind Pharma Limited (MANKINDNS) to inform your own strategic decisions.
- Finance Students: Acquire practical knowledge of valuation techniques through real-world data and examples related to Mankind Pharma Limited (MANKINDNS).
What the Template Contains
- Preloaded MANKINDNS Data: Historical and projected financial information, including revenue, EBIT, and capital expenditures.
- DCF and WACC Models: Advanced sheets designed for calculating intrinsic value and Weighted Average Cost of Capital.
- Editable Inputs: Cells highlighted in yellow for customizing revenue growth, tax rates, and discount rates.
- Financial Statements: In-depth annual and quarterly financials for thorough analysis.
- Key Ratios: Metrics for profitability, leverage, and efficiency to assess overall performance.
- Dashboard and Charts: Visual representations of valuation results and underlying assumptions.
Disclaimer
All information, articles, and product details provided on this website are for general informational and educational purposes only. We do not claim any ownership over, nor do we intend to infringe upon, any trademarks, copyrights, logos, brand names, or other intellectual property mentioned or depicted on this site. Such intellectual property remains the property of its respective owners, and any references here are made solely for identification or informational purposes, without implying any affiliation, endorsement, or partnership.
We make no representations or warranties, express or implied, regarding the accuracy, completeness, or suitability of any content or products presented. Nothing on this website should be construed as legal, tax, investment, financial, medical, or other professional advice. In addition, no part of this site—including articles or product references—constitutes a solicitation, recommendation, endorsement, advertisement, or offer to buy or sell any securities, franchises, or other financial instruments, particularly in jurisdictions where such activity would be unlawful.
All content is of a general nature and may not address the specific circumstances of any individual or entity. It is not a substitute for professional advice or services. Any actions you take based on the information provided here are strictly at your own risk. You accept full responsibility for any decisions or outcomes arising from your use of this website and agree to release us from any liability in connection with your use of, or reliance upon, the content or products found herein.