
|
Mazagon Dock Builders Limited (Mazdock.NS) Valoración de DCF |
Completamente Editable: Adáptelo A Sus Necesidades En Excel O Sheets
Diseño Profesional: Plantillas Confiables Y Estándares De La Industria
Predeterminadas Para Un Uso Rápido Y Eficiente
Compatible con MAC / PC, completamente desbloqueado
No Se Necesita Experiencia; Fáciles De Seguir
Mazagon Dock Shipbuilders Limited (MAZDOCK.NS) Bundle
¡Explore las perspectivas financieras de Mazagon Dock Builders Limited (Mazdockns) con nuestra calculadora DCF fácil de usar! Ingrese sus pronósticos para el crecimiento, los márgenes y los gastos para calcular el valor intrínseco de Mazagon Dock Builders Limited (Mazdockns) y dar forma a su enfoque de inversión.
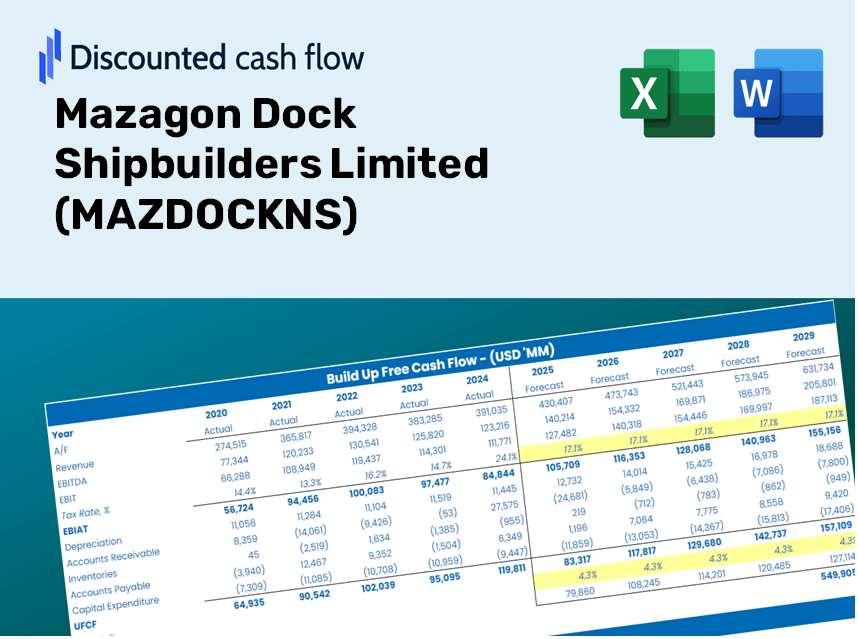
Discounted Cash Flow (DCF) - (USD MM)
| Year | AY1 2021 |
AY2 2022 |
AY3 2023 |
AY4 2024 |
AY5 2025 |
FY1 2026 |
FY2 2027 |
FY3 2028 |
FY4 2029 |
FY5 2030 |
|---|---|---|---|---|---|---|---|---|---|---|
| Revenue | 40,415.8 | 57,176.1 | 78,271.8 | 94,665.8 | 114,318.8 | 148,634.7 | 193,251.6 | 251,261.4 | 326,684.4 | 424,747.8 |
| Revenue Growth, % | 0 | 41.47 | 36.9 | 20.94 | 20.76 | 30.02 | 30.02 | 30.02 | 30.02 | 30.02 |
| EBITDA | 6,688.3 | 8,373.2 | 14,872.8 | 25,172.9 | 31,812.5 | 31,098.6 | 40,433.6 | 52,570.9 | 68,351.5 | 88,869.1 |
| EBITDA, % | 16.55 | 14.64 | 19 | 26.59 | 27.83 | 20.92 | 20.92 | 20.92 | 20.92 | 20.92 |
| Depreciation | 596.5 | 745.1 | 755.8 | 831.3 | 1,151.9 | 1,673.8 | 2,176.2 | 2,829.4 | 3,678.8 | 4,783.0 |
| Depreciation, % | 1.48 | 1.3 | 0.96561 | 0.87814 | 1.01 | 1.13 | 1.13 | 1.13 | 1.13 | 1.13 |
| EBIT | 6,091.8 | 7,628.1 | 14,117.0 | 24,341.6 | 30,660.6 | 29,424.8 | 38,257.5 | 49,741.5 | 64,672.8 | 84,086.1 |
| EBIT, % | 15.07 | 13.34 | 18.04 | 25.71 | 26.82 | 19.8 | 19.8 | 19.8 | 19.8 | 19.8 |
| Total Cash | 80,279.1 | 114,804.7 | 132,863.5 | 142,094.8 | 161,496.1 | 148,634.7 | 193,251.6 | 251,261.4 | 326,684.4 | 424,747.8 |
| Total Cash, percent | .0 | .0 | .0 | .0 | .0 | .0 | .0 | .0 | .0 | .0 |
| Account Receivables | 13,213.7 | 15,545.6 | 15,080.3 | 19,042.3 | 16,720.5 | 33,856.5 | 44,019.4 | 57,233.0 | 74,413.1 | 96,750.3 |
| Account Receivables, % | 32.69 | 27.19 | 19.27 | 20.12 | 14.63 | 22.78 | 22.78 | 22.78 | 22.78 | 22.78 |
| Inventories | 58,886.1 | 77,001.0 | 73,568.6 | 57,133.7 | 45,370.8 | 117,133.8 | 152,294.7 | 198,010.1 | 257,448.4 | 334,728.6 |
| Inventories, % | 145.7 | 134.67 | 93.99 | 60.35 | 39.69 | 78.81 | 78.81 | 78.81 | 78.81 | 78.81 |
| Accounts Payable | 63,001.3 | 61,012.3 | 44,633.6 | 44,669.9 | 37,383.0 | 100,153.5 | 130,217.3 | 169,305.7 | 220,127.4 | 286,204.8 |
| Accounts Payable, % | 155.88 | 106.71 | 57.02 | 47.19 | 32.7 | 67.38 | 67.38 | 67.38 | 67.38 | 67.38 |
| Capital Expenditure | -420.9 | -388.0 | -1,355.7 | -4,411.8 | -8,047.1 | -4,504.1 | -5,856.2 | -7,614.0 | -9,899.6 | -12,871.3 |
| Capital Expenditure, % | -1.04 | -0.67861 | -1.73 | -4.66 | -7.04 | -3.03 | -3.03 | -3.03 | -3.03 | -3.03 |
| Tax Rate, % | 24.53 | 24.53 | 24.53 | 24.53 | 24.53 | 24.53 | 24.53 | 24.53 | 24.53 | 24.53 |
| EBITAT | 4,712.9 | 5,845.9 | 10,705.4 | 18,468.6 | 23,140.6 | 22,432.3 | 29,166.0 | 37,921.0 | 49,304.0 | 64,103.9 |
| Depreciation | ||||||||||
| Changes in Account Receivables | ||||||||||
| Changes in Inventories | ||||||||||
| Changes in Accounts Payable | ||||||||||
| Capital Expenditure | ||||||||||
| UFCF | -4,210.0 | -16,232.8 | -2,375.5 | 27,397.3 | 23,043.2 | -6,526.5 | 10,226.0 | 13,295.6 | 17,286.6 | 22,475.7 |
| WACC, % | 6.67 | 6.67 | 6.67 | 6.67 | 6.67 | 6.67 | 6.67 | 6.67 | 6.67 | 6.67 |
| PV UFCF | ||||||||||
| SUM PV UFCF | 43,454.1 | |||||||||
| Long Term Growth Rate, % | 4.00 | |||||||||
| Free cash flow (T + 1) | 23,375 | |||||||||
| Terminal Value | 876,442 | |||||||||
| Present Terminal Value | 634,707 | |||||||||
| Enterprise Value | 678,161 | |||||||||
| Net Debt | -161,293 | |||||||||
| Equity Value | 839,454 | |||||||||
| Diluted Shares Outstanding, MM | 403 | |||||||||
| Equity Value Per Share | 2,081.37 |
What You Will Receive
- Genuine MAZDOCKNS Financial Data: Pre-populated with Mazagon Dock's historical and forecasted data for accurate analysis.
- Completely Customizable Template: Easily adjust essential inputs such as revenue growth, WACC, and EBITDA percentages.
- Real-Time Calculations: Watch as the intrinsic value of Mazagon Dock updates immediately based on your adjustments.
- Expert Valuation Tool: Tailored for investors, analysts, and consultants in search of reliable DCF results.
- Intuitive Interface: Straightforward layout and clear guidance suitable for users of all skill levels.
Key Features
- Authentic MAZDOCKNS Data: Pre-loaded with Mazagon Dock's historical financial performance and future projections.
- Customizable Parameters: Modify inputs such as revenue growth, profit margins, weighted average cost of capital (WACC), tax rates, and capital expenditures.
- Interactive Valuation Model: Automatically recalculates Net Present Value (NPV) and intrinsic value based on your customized inputs.
- Scenario Analysis: Generate various forecast scenarios to explore different potential valuation results.
- Intuitive Interface: User-friendly design catered to both experienced professionals and newcomers.
How It Works
- Step 1: Download the Excel file.
- Step 2: Review the pre-filled financial data and projections for Mazagon Dock Shipbuilders Limited (MAZDOCKNS).
- Step 3: Adjust key inputs such as revenue growth, WACC, and tax rates (indicated in highlighted cells).
- Step 4: Observe the DCF model refresh in real-time as you update your assumptions.
- Step 5: Evaluate the results and leverage the insights for your investment strategies.
Why Opt for This Calculator?
- All-in-One Solution: Features DCF, WACC, and financial ratio analyses conveniently packaged together.
- Flexible Inputs: Modify the yellow-highlighted cells to explore different scenarios.
- In-Depth Analysis: Automatically determines the intrinsic value and Net Present Value for Mazagon Dock Shipbuilders Limited (MAZDOCKNS).
- Ready-to-Use Data: Includes historical and projected data for precise initial calculations.
- Professional Standard: Perfect for financial analysts, investors, and business consultants.
Who Should Benefit from This Product?
- Individual Investors: Gain insights to make well-informed decisions regarding the buying or selling of Mazagon Dock Shipbuilders Limited (MAZDOCKNS) shares.
- Financial Analysts: Enhance valuation processes with comprehensive financial models that are ready for immediate application.
- Consultants: Provide clients with accurate and timely valuation insights relating to Mazagon Dock Shipbuilders Limited (MAZDOCKNS).
- Business Owners: Discover how major firms like Mazagon Dock Shipbuilders Limited (MAZDOCKNS) are valued to inform your own business strategies.
- Finance Students: Explore valuation techniques through real-world data and case studies involving Mazagon Dock Shipbuilders Limited (MAZDOCKNS).
What the Template Includes
- Comprehensive DCF Model: Editable template featuring detailed valuation calculations.
- Real-World Data: Mazagon Dock Shipbuilders Limited’s historical and projected financials preloaded for thorough analysis.
- Customizable Parameters: Modify WACC, growth rates, and tax assumptions to explore various scenarios.
- Financial Statements: Complete annual and quarterly breakdowns for enhanced insights.
- Key Ratios: Integrated analysis for profitability, efficiency, and leverage metrics.
- Dashboard with Visual Outputs: Charts and tables designed for clear, actionable results.
Disclaimer
All information, articles, and product details provided on this website are for general informational and educational purposes only. We do not claim any ownership over, nor do we intend to infringe upon, any trademarks, copyrights, logos, brand names, or other intellectual property mentioned or depicted on this site. Such intellectual property remains the property of its respective owners, and any references here are made solely for identification or informational purposes, without implying any affiliation, endorsement, or partnership.
We make no representations or warranties, express or implied, regarding the accuracy, completeness, or suitability of any content or products presented. Nothing on this website should be construed as legal, tax, investment, financial, medical, or other professional advice. In addition, no part of this site—including articles or product references—constitutes a solicitation, recommendation, endorsement, advertisement, or offer to buy or sell any securities, franchises, or other financial instruments, particularly in jurisdictions where such activity would be unlawful.
All content is of a general nature and may not address the specific circumstances of any individual or entity. It is not a substitute for professional advice or services. Any actions you take based on the information provided here are strictly at your own risk. You accept full responsibility for any decisions or outcomes arising from your use of this website and agree to release us from any liability in connection with your use of, or reliance upon, the content or products found herein.