
|
Valoración DCF de Monarch Casino & Resort, Inc. (MCRI) |
Completamente Editable: Adáptelo A Sus Necesidades En Excel O Sheets
Diseño Profesional: Plantillas Confiables Y Estándares De La Industria
Predeterminadas Para Un Uso Rápido Y Eficiente
Compatible con MAC / PC, completamente desbloqueado
No Se Necesita Experiencia; Fáciles De Seguir
Monarch Casino & Resort, Inc. (MCRI) Bundle
Explore el futuro financiero del casino monarca & Resort, Inc. (MCRI) ¡con nuestra calculadora DCF fácil de usar! Ingrese sus proyecciones para el crecimiento, los márgenes y los gastos para calcular el valor intrínseco del casino monarca & Resort, Inc. (MCRI) y mejorar su estrategia de inversión.
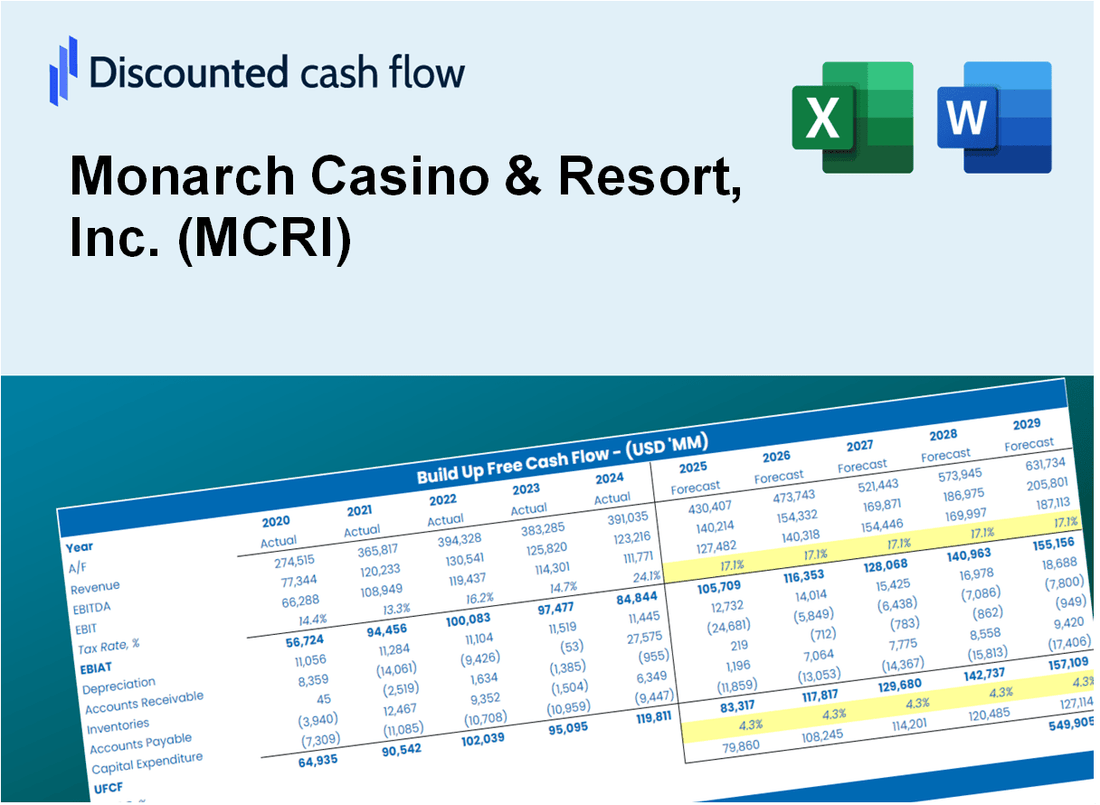
Discounted Cash Flow (DCF) - (USD MM)
| Year | AY1 2020 |
AY2 2021 |
AY3 2022 |
AY4 2023 |
AY5 2024 |
FY1 2025 |
FY2 2026 |
FY3 2027 |
FY4 2028 |
FY5 2029 |
|---|---|---|---|---|---|---|---|---|---|---|
| Revenue | 184.4 | 395.4 | 477.9 | 501.5 | 522.2 | 691.8 | 916.5 | 1,214.3 | 1,608.7 | 2,131.2 |
| Revenue Growth, % | 0 | 114.4 | 20.86 | 4.94 | 4.13 | 32.48 | 32.48 | 32.48 | 32.48 | 32.48 |
| EBITDA | 32.6 | 128.3 | 154.9 | 157.4 | 143.9 | 195.8 | 259.3 | 343.6 | 455.2 | 603.1 |
| EBITDA, % | 17.68 | 32.45 | 32.41 | 31.4 | 27.55 | 28.3 | 28.3 | 28.3 | 28.3 | 28.3 |
| Depreciation | 17.3 | 38.4 | 43.4 | 47.3 | 51.4 | 65.7 | 87.0 | 115.3 | 152.7 | 202.3 |
| Depreciation, % | 9.39 | 9.72 | 9.09 | 9.43 | 9.84 | 9.49 | 9.49 | 9.49 | 9.49 | 9.49 |
| EBIT | 15.3 | 89.9 | 111.4 | 110.2 | 92.5 | 130.1 | 172.3 | 228.3 | 302.5 | 400.7 |
| EBIT, % | 8.28 | 22.73 | 23.32 | 21.97 | 17.71 | 18.8 | 18.8 | 18.8 | 18.8 | 18.8 |
| Total Cash | 28.3 | 33.5 | 38.8 | 43.4 | 58.8 | 71.7 | 95.0 | 125.9 | 166.8 | 221.0 |
| Total Cash, percent | .0 | .0 | .0 | .0 | .0 | .0 | .0 | .0 | .0 | .0 |
| Account Receivables | 28.6 | 35.8 | 34.6 | 13.0 | 11.8 | 50.7 | 67.2 | 89.0 | 118.0 | 156.3 |
| Account Receivables, % | 15.52 | 9.06 | 7.23 | 2.59 | 2.26 | 7.33 | 7.33 | 7.33 | 7.33 | 7.33 |
| Inventories | 7.8 | 7.2 | 7.6 | 7.6 | 9.3 | 15.1 | 20.0 | 26.6 | 35.2 | 46.6 |
| Inventories, % | 4.24 | 1.81 | 1.58 | 1.52 | 1.78 | 2.19 | 2.19 | 2.19 | 2.19 | 2.19 |
| Accounts Payable | 11.7 | 18.6 | 14.4 | 23.1 | 41.2 | 36.7 | 48.6 | 64.4 | 85.4 | 113.1 |
| Accounts Payable, % | 6.32 | 4.7 | 3.02 | 4.6 | 7.9 | 5.31 | 5.31 | 5.31 | 5.31 | 5.31 |
| Capital Expenditure | -88.7 | -46.9 | -39.5 | -49.0 | -47.4 | -120.5 | -159.6 | -211.4 | -280.1 | -371.1 |
| Capital Expenditure, % | -48.08 | -11.87 | -8.26 | -9.77 | -9.08 | -17.41 | -17.41 | -17.41 | -17.41 | -17.41 |
| Tax Rate, % | 21.24 | 21.24 | 21.24 | 21.24 | 21.24 | 21.24 | 21.24 | 21.24 | 21.24 | 21.24 |
| EBITAT | 24.1 | 72.1 | 89.4 | 83.7 | 72.9 | 108.0 | 143.1 | 189.6 | 251.2 | 332.8 |
| Depreciation | ||||||||||
| Changes in Account Receivables | ||||||||||
| Changes in Inventories | ||||||||||
| Changes in Accounts Payable | ||||||||||
| Capital Expenditure | ||||||||||
| UFCF | -72.0 | 64.0 | 90.1 | 112.1 | 94.5 | 3.9 | 61.0 | 80.9 | 107.1 | 141.9 |
| WACC, % | 10.39 | 10.38 | 10.38 | 10.38 | 10.38 | 10.38 | 10.38 | 10.38 | 10.38 | 10.38 |
| PV UFCF | ||||||||||
| SUM PV UFCF | 272.6 | |||||||||
| Long Term Growth Rate, % | 3.00 | |||||||||
| Free cash flow (T + 1) | 146 | |||||||||
| Terminal Value | 1,981 | |||||||||
| Present Terminal Value | 1,209 | |||||||||
| Enterprise Value | 1,481 | |||||||||
| Net Debt | -45 | |||||||||
| Equity Value | 1,526 | |||||||||
| Diluted Shares Outstanding, MM | 19 | |||||||||
| Equity Value Per Share | 80.44 |
What You Will Get
- Real Monarch Data: Preloaded financials – from revenue to EBIT – based on actual and projected figures for Monarch Casino & Resort, Inc. (MCRI).
- Full Customization: Adjust all critical parameters (yellow cells) like WACC, growth %, and tax rates to fit your analysis.
- Instant Valuation Updates: Automatic recalculations to assess the impact of changes on the fair value of Monarch Casino & Resort, Inc. (MCRI).
- Versatile Excel Template: Designed for quick edits, scenario testing, and comprehensive projections.
- Time-Saving and Accurate: Avoid building models from scratch while ensuring precision and flexibility in your analysis.
Key Features
- Comprehensive Financial Data: Monarch Casino & Resort, Inc.’s historical financial statements and pre-populated projections.
- Customizable Parameters: Adjust WACC, tax rates, revenue growth, and EBITDA margins to fit your analysis.
- Real-Time Insights: Monitor Monarch’s intrinsic value recalculating instantly as inputs change.
- Intuitive Visualizations: Dashboard graphs present valuation outcomes and essential metrics clearly.
- Designed for Precision: A robust tool tailored for analysts, investors, and finance professionals.
How It Works
- 1. Access the Template: Download and open the Excel file featuring Monarch Casino & Resort, Inc.'s (MCRI) preloaded data.
- 2. Modify Assumptions: Adjust essential inputs such as growth rates, WACC, and capital expenditures.
- 3. View Results in Real-Time: The DCF model automatically calculates intrinsic value and NPV.
- 4. Evaluate Scenarios: Analyze various forecasts to explore different valuation results.
- 5. Utilize with Assurance: Present expert valuation insights to back your decision-making process.
Why Choose This Calculator for Monarch Casino & Resort, Inc. (MCRI)?
- Accuracy: Utilizes precise financial data from Monarch Casino & Resort, Inc. for reliable results.
- Flexibility: Allows users to easily adjust and experiment with various input parameters.
- Time-Saving: Eliminates the need to start a DCF model from the ground up.
- Professional-Grade: Crafted with the expertise and standards expected by CFOs.
- User-Friendly: Intuitive interface suitable for users without extensive financial modeling skills.
Who Should Use This Product?
- Investors: Accurately assess Monarch Casino & Resort, Inc.'s (MCRI) fair value prior to making investment choices.
- CFOs: Utilize a professional-grade DCF model for financial reporting and analysis specific to Monarch Casino & Resort, Inc. (MCRI).
- Consultants: Efficiently modify the template for valuation reports tailored to clients in the gaming and hospitality industry.
- Entrepreneurs: Acquire knowledge on financial modeling practices employed by leading casino and resort companies.
- Educators: Implement it as a teaching resource to illustrate valuation techniques in the context of the gaming sector.
What the Template Contains
- Pre-Filled DCF Model: Monarch Casino & Resort, Inc. (MCRI)’s financial data preloaded for immediate use.
- WACC Calculator: Detailed calculations for Weighted Average Cost of Capital.
- Financial Ratios: Evaluate Monarch Casino & Resort, Inc. (MCRI)’s profitability, leverage, and efficiency.
- Editable Inputs: Change assumptions such as growth, margins, and CAPEX to fit your scenarios.
- Financial Statements: Annual and quarterly reports to support detailed analysis.
- Interactive Dashboard: Easily visualize key valuation metrics and results.
Disclaimer
All information, articles, and product details provided on this website are for general informational and educational purposes only. We do not claim any ownership over, nor do we intend to infringe upon, any trademarks, copyrights, logos, brand names, or other intellectual property mentioned or depicted on this site. Such intellectual property remains the property of its respective owners, and any references here are made solely for identification or informational purposes, without implying any affiliation, endorsement, or partnership.
We make no representations or warranties, express or implied, regarding the accuracy, completeness, or suitability of any content or products presented. Nothing on this website should be construed as legal, tax, investment, financial, medical, or other professional advice. In addition, no part of this site—including articles or product references—constitutes a solicitation, recommendation, endorsement, advertisement, or offer to buy or sell any securities, franchises, or other financial instruments, particularly in jurisdictions where such activity would be unlawful.
All content is of a general nature and may not address the specific circumstances of any individual or entity. It is not a substitute for professional advice or services. Any actions you take based on the information provided here are strictly at your own risk. You accept full responsibility for any decisions or outcomes arising from your use of this website and agree to release us from any liability in connection with your use of, or reliance upon, the content or products found herein.