
|
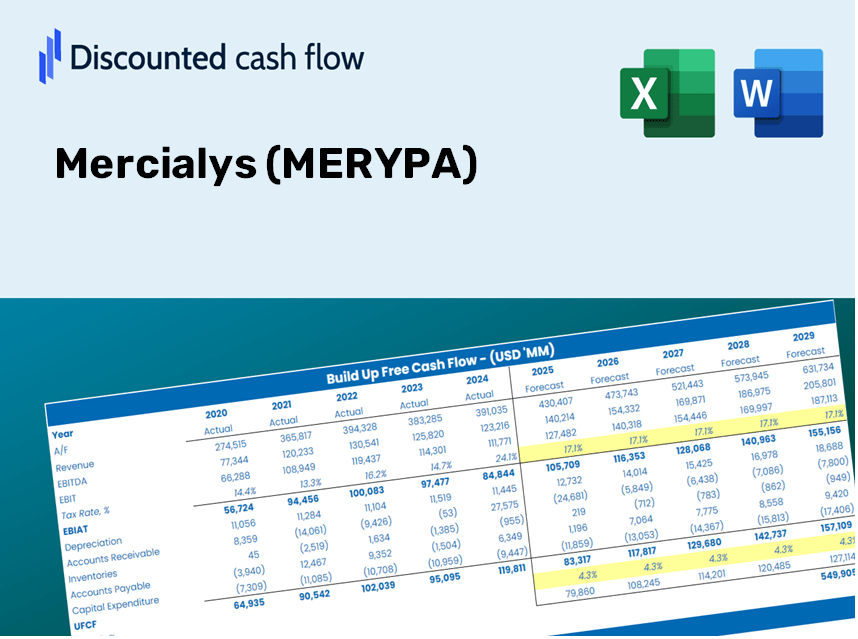
Valoración de DCF Mercialys (Mery.PA) |
Completamente Editable: Adáptelo A Sus Necesidades En Excel O Sheets
Diseño Profesional: Plantillas Confiables Y Estándares De La Industria
Predeterminadas Para Un Uso Rápido Y Eficiente
Compatible con MAC / PC, completamente desbloqueado
No Se Necesita Experiencia; Fáciles De Seguir
Mercialys (MERY.PA) Bundle
¡Simplifique la valoración de Mercialys (Merypa) con esta calculadora DCF personalizable! Con las finanzas de Real Mercialys (Merypa) y las entradas de pronóstico ajustables, puede probar escenarios y descubrir el valor razonable de Mercialys (Merypa) en minutos.
What You Will Receive
- Pre-Loaded Financial Model: Mercialys’ actual data facilitates accurate DCF valuation.
- Comprehensive Forecast Control: Modify revenue growth, profit margins, WACC, and other essential metrics.
- Real-Time Calculations: Automatic updates provide immediate feedback as you make adjustments.
- Investor-Ready Template: A polished Excel file crafted for professional-level valuation.
- Flexible and Reusable: Designed for adaptability, allowing for repeated application in detailed forecasts.
Key Features
- Pre-Loaded Data: Mercialys’ historical financial statements and pre-filled forecasts.
- Fully Adjustable Inputs: Modify WACC, tax rates, revenue growth, and EBITDA margins as needed.
- Instant Results: Observe Mercialys’ intrinsic value recalculating in real time.
- Clear Visual Outputs: Dashboard charts showcase valuation results and key performance indicators.
- Built for Accuracy: A reliable tool tailored for analysts, investors, and finance professionals.
How It Functions
- Step 1: Download the ready-to-use Excel template featuring Mercialys' data.
- Step 2: Examine the pre-populated sheets to familiarize yourself with the crucial metrics.
- Step 3: Adjust forecasts and assumptions in the editable yellow cells (WACC, growth, margins).
- Step 4: Instantly see the recalculated results, including Mercialys' intrinsic value.
- Step 5: Make well-informed investment choices or create reports based on the outputs.
Why Choose This Calculator for Mercialys (MERYPA)?
- All-in-One Solution: Features DCF, WACC, and financial ratio analyses conveniently packaged together.
- Flexible Inputs: Modify the yellow-highlighted cells to explore different scenarios.
- In-Depth Analysis: Automatically computes the intrinsic value and Net Present Value for Mercialys.
- Preloaded Information: Access both historical and projected data for reliable starting points.
- Professional Grade: Perfect for financial analysts, investors, and business consultants focusing on Mercialys (MERYPA).
Who Should Consider This Product?
- Investors: Evaluate Mercialys’ valuation before making stock transactions.
- CFOs and Financial Analysts: Optimize valuation methodologies and assess financial forecasts.
- Startup Founders: Gain insights into how established firms like Mercialys are valued.
- Consultants: Provide expert valuation assessments and reports for clients.
- Students and Educators: Utilize real data to practice and demonstrate valuation strategies.
What the Template Includes
- Pre-Filled DCF Model: Mercialys's financial data preloaded for immediate analysis.
- WACC Calculator: Comprehensive calculations for Weighted Average Cost of Capital.
- Financial Ratios: Assess Mercialys's profitability, leverage, and efficiency.
- Editable Inputs: Adjust parameters like growth, margins, and CAPEX to suit your scenarios.
- Financial Statements: Annual and quarterly reports for in-depth analysis.
- Interactive Dashboard: Effortlessly visualize essential valuation metrics and outcomes.
Disclaimer
All information, articles, and product details provided on this website are for general informational and educational purposes only. We do not claim any ownership over, nor do we intend to infringe upon, any trademarks, copyrights, logos, brand names, or other intellectual property mentioned or depicted on this site. Such intellectual property remains the property of its respective owners, and any references here are made solely for identification or informational purposes, without implying any affiliation, endorsement, or partnership.
We make no representations or warranties, express or implied, regarding the accuracy, completeness, or suitability of any content or products presented. Nothing on this website should be construed as legal, tax, investment, financial, medical, or other professional advice. In addition, no part of this site—including articles or product references—constitutes a solicitation, recommendation, endorsement, advertisement, or offer to buy or sell any securities, franchises, or other financial instruments, particularly in jurisdictions where such activity would be unlawful.
All content is of a general nature and may not address the specific circumstances of any individual or entity. It is not a substitute for professional advice or services. Any actions you take based on the information provided here are strictly at your own risk. You accept full responsibility for any decisions or outcomes arising from your use of this website and agree to release us from any liability in connection with your use of, or reliance upon, the content or products found herein.