
|
Valoración de DCF de Metro Brands Limited (Metrobrand.NS) |
Completamente Editable: Adáptelo A Sus Necesidades En Excel O Sheets
Diseño Profesional: Plantillas Confiables Y Estándares De La Industria
Predeterminadas Para Un Uso Rápido Y Eficiente
Compatible con MAC / PC, completamente desbloqueado
No Se Necesita Experiencia; Fáciles De Seguir
Metro Brands Limited (METROBRAND.NS) Bundle
¡Agilice su análisis y mejore la precisión con nuestra calculadora DCF (Metrobrandns)! Equipado con datos reales de suposiciones limitadas y personalizables de Metro Brands, esta herramienta le permite pronosticar, evaluar y evaluar marcas de metro como un inversor experimentado.
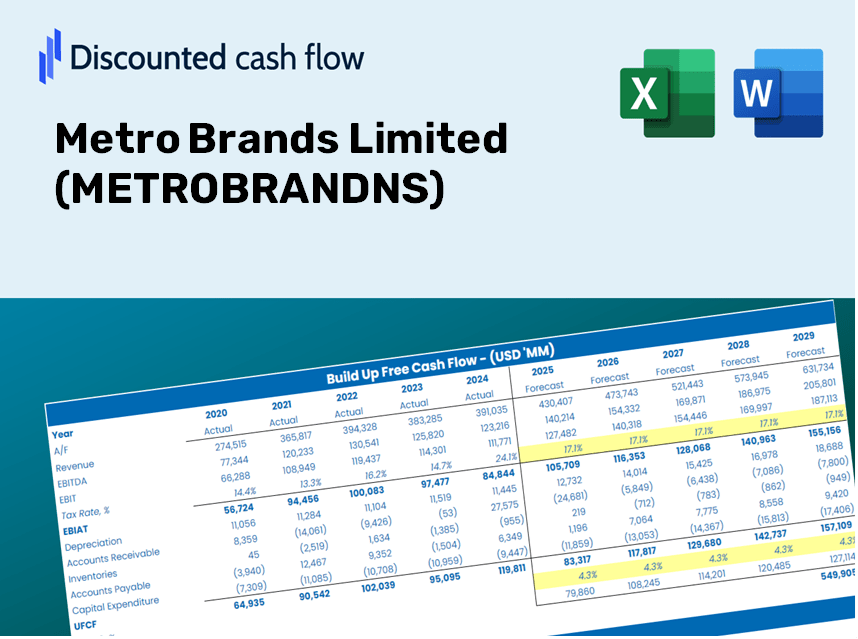
Discounted Cash Flow (DCF) - (USD MM)
| Year | AY1 2021 |
AY2 2022 |
AY3 2023 |
AY4 2024 |
AY5 2025 |
FY1 2026 |
FY2 2027 |
FY3 2028 |
FY4 2029 |
FY5 2030 |
|---|---|---|---|---|---|---|---|---|---|---|
| Revenue | 8,000.6 | 13,429.3 | 21,271.0 | 23,567.0 | 25,073.9 | 34,065.1 | 46,280.4 | 62,876.0 | 85,422.5 | 116,053.9 |
| Revenue Growth, % | 0 | 67.85 | 58.39 | 10.79 | 6.39 | 35.86 | 35.86 | 35.86 | 35.86 | 35.86 |
| EBITDA | 815.6 | 3,075.9 | 5,426.7 | 5,322.8 | 5,644.8 | 7,065.7 | 9,599.4 | 13,041.7 | 17,718.2 | 24,071.8 |
| EBITDA, % | 10.19 | 22.9 | 25.51 | 22.59 | 22.51 | 20.74 | 20.74 | 20.74 | 20.74 | 20.74 |
| Depreciation | 279.9 | 289.0 | 427.3 | 562.9 | 604.6 | 848.9 | 1,153.2 | 1,566.8 | 2,128.6 | 2,891.9 |
| Depreciation, % | 3.5 | 2.15 | 2.01 | 2.39 | 2.41 | 2.49 | 2.49 | 2.49 | 2.49 | 2.49 |
| EBIT | 535.7 | 2,786.9 | 4,999.4 | 4,759.9 | 5,040.2 | 6,216.9 | 8,446.2 | 11,474.9 | 15,589.6 | 21,179.9 |
| EBIT, % | 6.7 | 20.75 | 23.5 | 20.2 | 20.1 | 18.25 | 18.25 | 18.25 | 18.25 | 18.25 |
| Total Cash | 4,802.9 | 7,841.7 | 6,643.0 | 8,472.7 | 6,304.1 | 14,358.4 | 19,507.1 | 26,502.1 | 36,005.4 | 48,916.5 |
| Total Cash, percent | .0 | .0 | .0 | .0 | .0 | .0 | .0 | .0 | .0 | .0 |
| Account Receivables | 505.5 | 554.1 | 1,162.5 | 828.4 | 926.0 | 1,575.0 | 2,139.8 | 2,907.1 | 3,949.5 | 5,365.8 |
| Account Receivables, % | 6.32 | 4.13 | 5.47 | 3.52 | 3.69 | 4.62 | 4.62 | 4.62 | 4.62 | 4.62 |
| Inventories | 2,897.6 | 4,241.9 | 6,457.6 | 7,101.5 | 6,369.0 | 10,471.4 | 14,226.3 | 19,327.7 | 26,258.3 | 35,674.2 |
| Inventories, % | 36.22 | 31.59 | 30.36 | 30.13 | 25.4 | 30.74 | 30.74 | 30.74 | 30.74 | 30.74 |
| Accounts Payable | 2,046.5 | 2,113.6 | 2,947.0 | 2,570.4 | 2,258.1 | 5,115.6 | 6,950.0 | 9,442.1 | 12,827.9 | 17,427.9 |
| Accounts Payable, % | 25.58 | 15.74 | 13.85 | 10.91 | 9.01 | 15.02 | 15.02 | 15.02 | 15.02 | 15.02 |
| Capital Expenditure | -251.0 | -479.2 | -996.4 | -1,161.3 | -874.0 | -1,349.2 | -1,833.0 | -2,490.3 | -3,383.3 | -4,596.5 |
| Capital Expenditure, % | -3.14 | -3.57 | -4.68 | -4.93 | -3.49 | -3.96 | -3.96 | -3.96 | -3.96 | -3.96 |
| Tax Rate, % | 30.38 | 30.38 | 30.38 | 30.38 | 30.38 | 30.38 | 30.38 | 30.38 | 30.38 | 30.38 |
| EBITAT | 435.4 | 2,073.6 | 3,679.3 | 4,219.0 | 3,509.2 | 4,818.6 | 6,546.5 | 8,893.9 | 12,083.2 | 16,416.1 |
| Depreciation | ||||||||||
| Changes in Account Receivables | ||||||||||
| Changes in Inventories | ||||||||||
| Changes in Accounts Payable | ||||||||||
| Capital Expenditure | ||||||||||
| UFCF | -892.3 | 557.6 | 1,119.5 | 2,934.2 | 3,562.4 | 2,424.3 | 3,381.4 | 4,593.9 | 6,241.3 | 8,479.3 |
| WACC, % | 4.71 | 4.69 | 4.68 | 4.73 | 4.67 | 4.69 | 4.69 | 4.69 | 4.69 | 4.69 |
| PV UFCF | ||||||||||
| SUM PV UFCF | 21,339.9 | |||||||||
| Long Term Growth Rate, % | 4.00 | |||||||||
| Free cash flow (T + 1) | 8,818 | |||||||||
| Terminal Value | 1,269,725 | |||||||||
| Present Terminal Value | 1,009,462 | |||||||||
| Enterprise Value | 1,030,802 | |||||||||
| Net Debt | 11,261 | |||||||||
| Equity Value | 1,019,541 | |||||||||
| Diluted Shares Outstanding, MM | 273 | |||||||||
| Equity Value Per Share | 3,735.20 |
What You Will Receive
- Flexible Forecast Inputs: Adjust key assumptions (growth %, margins, WACC) effortlessly to develop various scenarios.
- Real-World Data: Metro Brands Limited’s financial data pre-loaded to kickstart your analysis.
- Automated DCF Outputs: The template computes Net Present Value (NPV) and intrinsic value automatically.
- Customizable and Professional: A refined Excel model tailored to meet your valuation requirements.
- Designed for Analysts and Investors: Perfect for evaluating projections, validating strategies, and enhancing efficiency.
Key Features
- Customizable Forecast Inputs: Adjust essential factors such as revenue growth, EBITDA %, and capital expenditures.
- Instant DCF Valuation: Automatically computes intrinsic value, NPV, and other key metrics in real-time.
- High-Precision Accuracy: Leverages Metro Brands Limited’s (METROBRANDNS) actual financial data for reliable valuation results.
- Simplified Scenario Analysis: Effortlessly examine various assumptions and assess different outcomes.
- Efficiency Booster: Avoid the complexity of creating intricate valuation models from the ground up.
How It Functions
- 1. Access the Template: Download and open the Excel file featuring Metro Brands Limited’s (METROBRANDNS) preloaded data.
- 2. Modify Assumptions: Adjust key inputs such as growth rates, WACC, and capital expenditures as needed.
- 3. View Results Instantly: The DCF model automatically calculates the intrinsic value and NPV for your inputs.
- 4. Explore Scenarios: Analyze various forecasts to understand different valuation outcomes.
- 5. Utilize with Assurance: Present well-supported valuation insights to guide your strategic decisions.
Why Opt for the Metro Brands Limited Calculator?
- Precision: Utilizes authentic Metro Brands financial data for reliable insights.
- Adaptability: Tailored for users to experiment with and adjust inputs seamlessly.
- Efficiency: Avoid the complexity of constructing a DCF model from the ground up.
- Expert-Level: Crafted with the accuracy and functionality expected by CFOs.
- Intuitive: Simple to navigate, making it accessible for those new to financial modeling.
Who Can Benefit from This Product?
- Investors: Assess Metro Brands Limited's (METROBRANDNS) valuation before making stock transactions.
- CFOs and Financial Analysts: Optimize valuation procedures and evaluate forecasts.
- Startup Founders: Gain insights into how established companies like Metro Brands Limited are valued.
- Consultants: Provide comprehensive valuation reports for your clients.
- Students and Educators: Utilize actual data to learn and teach valuation methods.
What the Template Includes
- Comprehensive DCF Model: Fully customizable template featuring intricate valuation calculations.
- Real-World Data: Metro Brands Limited’s historical and projected financials preloaded for comprehensive analysis.
- Customizable Parameters: Modify WACC, growth rates, and tax assumptions to explore various scenarios.
- Financial Statements: Detailed annual and quarterly breakdowns for enhanced insights.
- Key Ratios: Integrated analysis for profitability, efficiency, and leverage metrics.
- Dashboard with Visual Outputs: Graphs and tables designed for clear, actionable insights.
Disclaimer
All information, articles, and product details provided on this website are for general informational and educational purposes only. We do not claim any ownership over, nor do we intend to infringe upon, any trademarks, copyrights, logos, brand names, or other intellectual property mentioned or depicted on this site. Such intellectual property remains the property of its respective owners, and any references here are made solely for identification or informational purposes, without implying any affiliation, endorsement, or partnership.
We make no representations or warranties, express or implied, regarding the accuracy, completeness, or suitability of any content or products presented. Nothing on this website should be construed as legal, tax, investment, financial, medical, or other professional advice. In addition, no part of this site—including articles or product references—constitutes a solicitation, recommendation, endorsement, advertisement, or offer to buy or sell any securities, franchises, or other financial instruments, particularly in jurisdictions where such activity would be unlawful.
All content is of a general nature and may not address the specific circumstances of any individual or entity. It is not a substitute for professional advice or services. Any actions you take based on the information provided here are strictly at your own risk. You accept full responsibility for any decisions or outcomes arising from your use of this website and agree to release us from any liability in connection with your use of, or reliance upon, the content or products found herein.