
|
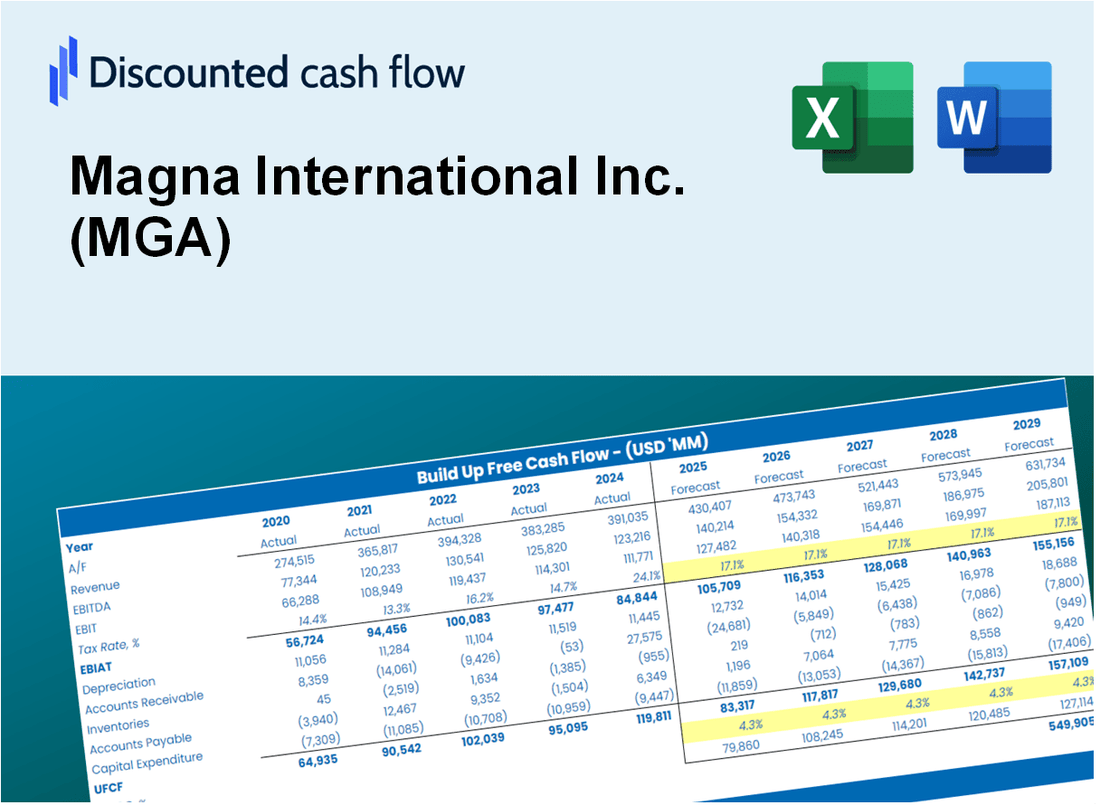
Valoración DCF de Magna International Inc. (MGA) |
Completamente Editable: Adáptelo A Sus Necesidades En Excel O Sheets
Diseño Profesional: Plantillas Confiables Y Estándares De La Industria
Predeterminadas Para Un Uso Rápido Y Eficiente
Compatible con MAC / PC, completamente desbloqueado
No Se Necesita Experiencia; Fáciles De Seguir
Magna International Inc. (MGA) Bundle
¿Busca evaluar el valor intrínseco de Magna International Inc.? Nuestra calculadora DCF (MGA) integra datos del mundo real con extensas características de personalización, lo que le permite refinar sus pronósticos y mejorar sus estrategias de inversión.
What You Will Get
- Real MGA Financial Data: Pre-filled with Magna International’s historical and projected data for precise analysis.
- Fully Editable Template: Modify key inputs like revenue growth, WACC, and EBITDA % with ease.
- Automatic Calculations: See Magna International’s intrinsic value update instantly based on your changes.
- Professional Valuation Tool: Designed for investors, analysts, and consultants seeking accurate DCF results.
- User-Friendly Design: Simple structure and clear instructions for all experience levels.
Key Features
- Customizable Forecast Inputs: Adjust essential variables such as revenue growth, EBITDA margin, and capital investments.
- Instant DCF Valuation: Provides real-time calculations of intrinsic value, NPV, and additional financial metrics.
- High-Precision Accuracy: Employs Magna International Inc.'s (MGA) actual financial data for credible valuation results.
- Effortless Scenario Testing: Easily evaluate various assumptions and analyze different outcomes.
- Efficiency Booster: Remove the hassle of constructing intricate valuation models from the ground up.
How It Works
- Download: Obtain the pre-formatted Excel file containing Magna International Inc.'s (MGA) financial information.
- Customize: Modify projections, including sales growth, EBITDA margin, and WACC.
- Update Automatically: The intrinsic value and NPV calculations refresh in real-time.
- Test Scenarios: Develop various forecasts and assess results immediately.
- Make Decisions: Leverage the valuation findings to inform your investment approach.
Why Choose This Calculator?
- Accurate Data: Real Magna International Inc. (MGA) financials ensure reliable valuation results.
- Customizable: Adjust key parameters like growth rates, WACC, and tax rates to align with your projections.
- Time-Saving: Pre-built calculations save you from starting from scratch.
- Professional-Grade Tool: Tailored for investors, analysts, and consultants in the automotive industry.
- User-Friendly: Intuitive design and step-by-step instructions make it accessible for all users.
Who Should Use This Product?
- Individual Investors: Make informed decisions about buying or selling Magna International Inc. (MGA) stock.
- Financial Analysts: Streamline valuation processes with ready-to-use financial models for Magna International Inc. (MGA).
- Consultants: Deliver professional valuation insights on Magna International Inc. (MGA) to clients quickly and accurately.
- Business Owners: Understand how large companies like Magna International Inc. (MGA) are valued to guide your own strategy.
- Finance Students: Learn valuation techniques using real-world data and scenarios related to Magna International Inc. (MGA).
What the Template Contains
- Pre-Filled DCF Model: Magna International Inc.'s (MGA) financial data preloaded for immediate use.
- WACC Calculator: Detailed calculations for Weighted Average Cost of Capital.
- Financial Ratios: Evaluate Magna's profitability, leverage, and efficiency.
- Editable Inputs: Change assumptions such as growth, margins, and CAPEX to fit your scenarios.
- Financial Statements: Annual and quarterly reports to support detailed analysis.
- Interactive Dashboard: Easily visualize key valuation metrics and results.
Disclaimer
All information, articles, and product details provided on this website are for general informational and educational purposes only. We do not claim any ownership over, nor do we intend to infringe upon, any trademarks, copyrights, logos, brand names, or other intellectual property mentioned or depicted on this site. Such intellectual property remains the property of its respective owners, and any references here are made solely for identification or informational purposes, without implying any affiliation, endorsement, or partnership.
We make no representations or warranties, express or implied, regarding the accuracy, completeness, or suitability of any content or products presented. Nothing on this website should be construed as legal, tax, investment, financial, medical, or other professional advice. In addition, no part of this site—including articles or product references—constitutes a solicitation, recommendation, endorsement, advertisement, or offer to buy or sell any securities, franchises, or other financial instruments, particularly in jurisdictions where such activity would be unlawful.
All content is of a general nature and may not address the specific circumstances of any individual or entity. It is not a substitute for professional advice or services. Any actions you take based on the information provided here are strictly at your own risk. You accept full responsibility for any decisions or outcomes arising from your use of this website and agree to release us from any liability in connection with your use of, or reliance upon, the content or products found herein.