
|
Valoración de DCF de Morgan Sindall Group PLC (MGNS.L) |
Completamente Editable: Adáptelo A Sus Necesidades En Excel O Sheets
Diseño Profesional: Plantillas Confiables Y Estándares De La Industria
Predeterminadas Para Un Uso Rápido Y Eficiente
Compatible con MAC / PC, completamente desbloqueado
No Se Necesita Experiencia; Fáciles De Seguir
Morgan Sindall Group plc (MGNS.L) Bundle
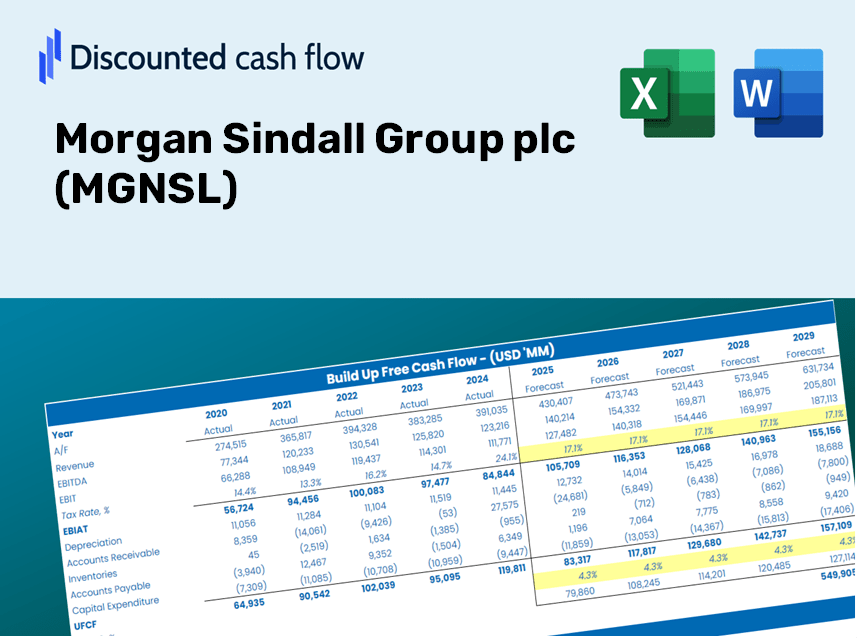
¡Obtenga información sobre su análisis de valoración de Morgan Sindall Group PLC (MGNSL) utilizando nuestra sofisticada calculadora DCF! Esta plantilla de Excel viene precisa con datos precisos (MGNSL), lo que le permite ajustar los pronósticos y supuestos para determinar el valor intrínseco de Morgan Sindall Group PLC con precisión.
Discounted Cash Flow (DCF) - (USD MM)
| Year | AY1 2020 |
AY2 2021 |
AY3 2022 |
AY4 2023 |
AY5 2024 |
FY1 2025 |
FY2 2026 |
FY3 2027 |
FY4 2028 |
FY5 2029 |
|---|---|---|---|---|---|---|---|---|---|---|
| Revenue | 3,034.0 | 3,212.8 | 3,612.2 | 4,117.7 | 4,546.2 | 5,031.8 | 5,569.3 | 6,164.1 | 6,822.5 | 7,551.3 |
| Revenue Growth, % | 0 | 5.89 | 12.43 | 13.99 | 10.41 | 10.68 | 10.68 | 10.68 | 10.68 | 10.68 |
| EBITDA | 89.1 | 147.0 | 111.0 | 162.9 | 209.3 | 192.7 | 213.2 | 236.0 | 261.2 | 289.1 |
| EBITDA, % | 2.94 | 4.58 | 3.07 | 3.96 | 4.6 | 3.83 | 3.83 | 3.83 | 3.83 | 3.83 |
| Depreciation | 25.1 | 22.0 | 24.9 | 29.7 | 33.6 | 36.9 | 40.8 | 45.1 | 50.0 | 55.3 |
| Depreciation, % | 0.82729 | 0.68476 | 0.68933 | 0.72128 | 0.73908 | 0.73235 | 0.73235 | 0.73235 | 0.73235 | 0.73235 |
| EBIT | 64.0 | 125.0 | 86.1 | 133.2 | 175.7 | 155.8 | 172.5 | 190.9 | 211.3 | 233.8 |
| EBIT, % | 2.11 | 3.89 | 2.38 | 3.23 | 3.86 | 3.1 | 3.1 | 3.1 | 3.1 | 3.1 |
| Total Cash | 400.5 | 468.6 | 431.7 | 541.3 | 544.2 | 652.7 | 722.4 | 799.5 | 884.9 | 979.4 |
| Total Cash, percent | .0 | .0 | .0 | .0 | .0 | .0 | .0 | .0 | .0 | .0 |
| Account Receivables | 395.1 | 549.2 | 635.0 | 714.4 | 662.0 | 801.1 | 886.7 | 981.4 | 1,086.2 | 1,202.3 |
| Account Receivables, % | 13.02 | 17.09 | 17.58 | 17.35 | 14.56 | 15.92 | 15.92 | 15.92 | 15.92 | 15.92 |
| Inventories | 294.2 | 288.5 | 333.9 | 344.7 | 476.0 | 470.6 | 520.9 | 576.5 | 638.1 | 706.2 |
| Inventories, % | 9.7 | 8.98 | 9.24 | 8.37 | 10.47 | 9.35 | 9.35 | 9.35 | 9.35 | 9.35 |
| Accounts Payable | 189.2 | 157.6 | 165.4 | 202.2 | 211.1 | 254.3 | 281.5 | 311.6 | 344.9 | 381.7 |
| Accounts Payable, % | 6.24 | 4.91 | 4.58 | 4.91 | 4.64 | 5.05 | 5.05 | 5.05 | 5.05 | 5.05 |
| Capital Expenditure | -5.8 | -8.0 | -11.8 | -14.3 | -18.2 | -15.2 | -16.9 | -18.7 | -20.7 | -22.9 |
| Capital Expenditure, % | -0.19117 | -0.249 | -0.32667 | -0.34728 | -0.40033 | -0.30289 | -0.30289 | -0.30289 | -0.30289 | -0.30289 |
| Tax Rate, % | 23.39 | 23.39 | 23.39 | 23.39 | 23.39 | 23.39 | 23.39 | 23.39 | 23.39 | 23.39 |
| EBITAT | 47.8 | 97.0 | 61.5 | 108.9 | 134.6 | 119.1 | 131.8 | 145.9 | 161.4 | 178.7 |
| Depreciation | ||||||||||
| Changes in Account Receivables | ||||||||||
| Changes in Inventories | ||||||||||
| Changes in Accounts Payable | ||||||||||
| Capital Expenditure | ||||||||||
| UFCF | -433.0 | -69.0 | -48.8 | 70.9 | 80.0 | 50.2 | 47.0 | 52.0 | 57.6 | 63.8 |
| WACC, % | 7.57 | 7.58 | 7.56 | 7.6 | 7.58 | 7.58 | 7.58 | 7.58 | 7.58 | 7.58 |
| PV UFCF | ||||||||||
| SUM PV UFCF | 216.4 | |||||||||
| Long Term Growth Rate, % | 2.00 | |||||||||
| Free cash flow (T + 1) | 65 | |||||||||
| Terminal Value | 1,167 | |||||||||
| Present Terminal Value | 810 | |||||||||
| Enterprise Value | 1,026 | |||||||||
| Net Debt | -426 | |||||||||
| Equity Value | 1,452 | |||||||||
| Diluted Shares Outstanding, MM | 49 | |||||||||
| Equity Value Per Share | 2,993.36 |
What You Will Receive
- Authentic Morgan Sindall Data: Comprehensive financials – including revenue and EBIT – derived from real and forecasted figures.
- Complete Customization: Modify all essential parameters (highlighted in yellow) such as WACC, growth rates, and tax percentages.
- Immediate Valuation Adjustments: Automatic recalculations to evaluate the impact of changes on the fair value of Morgan Sindall Group plc (MGNSL).
- Adaptable Excel Template: Designed for swift modifications, scenario analysis, and in-depth projections.
- Efficient and Precise: Eliminate the need to build models from the ground up while ensuring accuracy and adaptability.
Key Features
- Comprehensive DCF Calculator: Features both unlevered and levered DCF valuation models tailored for Morgan Sindall Group plc (MGNSL).
- WACC Calculator: A user-friendly Weighted Average Cost of Capital sheet with adjustable inputs for precise calculations.
- Customizable Forecast Assumptions: Easily adjust growth rates, capital expenditures, and discount rates according to your analysis needs.
- Integrated Financial Ratios: Evaluate profitability, leverage, and efficiency ratios specifically for Morgan Sindall Group plc (MGNSL).
- Interactive Dashboard and Charts: Visual representations of key valuation metrics to facilitate straightforward analysis.
How It Works
- Download the Template: Gain immediate access to the Excel-based MGNSL Discounted Cash Flow (DCF) Calculator.
- Input Your Assumptions: Modify the yellow-highlighted cells for growth rates, WACC, profit margins, and more.
- Instant Calculations: The model automatically recalculates Morgan Sindall Group plc's intrinsic value.
- Test Scenarios: Experiment with different assumptions to see how they affect potential valuations.
- Analyze and Decide: Utilize the outcomes to inform your investment or financial decision-making process.
Why Opt for This Calculator?
- Precision: Utilizes genuine Morgan Sindall Group plc (MGNSL) financial data for reliable results.
- Customizability: Built to allow users to easily adjust and experiment with inputs.
- Efficiency: Eliminate the need to create a DCF model from the ground up.
- Expert-Level: Crafted with the accuracy and usability expected by industry-leading executives.
- Intuitive: Simple enough for anyone, regardless of their financial modeling background.
Who Can Benefit from This Product?
- Construction Management Students: Master project evaluation techniques and apply them using real-world data.
- Researchers: Integrate industry-standard models into your academic studies or research initiatives.
- Investors: Validate your strategies and assess valuation outcomes for Morgan Sindall Group plc (MGNSL) stock.
- Industry Analysts: Enhance your efficiency with a ready-to-use, customizable DCF model tailored for the construction sector.
- Small to Medium-Sized Enterprises (SMEs): Understand the analytical approaches applied to large public construction companies like Morgan Sindall Group plc (MGNSL).
Contents of the Template
- Pre-Filled Data: Features historical financial data and forecasts for Morgan Sindall Group plc (MGNSL).
- Discounted Cash Flow Model: Editable DCF valuation model equipped with automated calculations.
- Weighted Average Cost of Capital (WACC): A dedicated sheet for WACC calculations based on custom inputs.
- Key Financial Ratios: Evaluate the profitability, efficiency, and leverage of Morgan Sindall Group plc (MGNSL).
- Customizable Inputs: Easily modify revenue growth, margins, and tax rates.
- Clear Dashboard: Visual representations through charts and tables summarizing essential valuation results.
Disclaimer
All information, articles, and product details provided on this website are for general informational and educational purposes only. We do not claim any ownership over, nor do we intend to infringe upon, any trademarks, copyrights, logos, brand names, or other intellectual property mentioned or depicted on this site. Such intellectual property remains the property of its respective owners, and any references here are made solely for identification or informational purposes, without implying any affiliation, endorsement, or partnership.
We make no representations or warranties, express or implied, regarding the accuracy, completeness, or suitability of any content or products presented. Nothing on this website should be construed as legal, tax, investment, financial, medical, or other professional advice. In addition, no part of this site—including articles or product references—constitutes a solicitation, recommendation, endorsement, advertisement, or offer to buy or sell any securities, franchises, or other financial instruments, particularly in jurisdictions where such activity would be unlawful.
All content is of a general nature and may not address the specific circumstances of any individual or entity. It is not a substitute for professional advice or services. Any actions you take based on the information provided here are strictly at your own risk. You accept full responsibility for any decisions or outcomes arising from your use of this website and agree to release us from any liability in connection with your use of, or reliance upon, the content or products found herein.