
|
Valoración DCF de MIND Technology, Inc. (MIND) |
Completamente Editable: Adáptelo A Sus Necesidades En Excel O Sheets
Diseño Profesional: Plantillas Confiables Y Estándares De La Industria
Predeterminadas Para Un Uso Rápido Y Eficiente
Compatible con MAC / PC, completamente desbloqueado
No Se Necesita Experiencia; Fáciles De Seguir
MIND Technology, Inc. (MIND) Bundle
¡Mejore sus opciones de inversión con la calculadora DCF de Mind Technology, Inc. (Mind)! Explore los datos financieros precisos para la mente, ajuste las proyecciones y gastos de crecimiento, y observe instantáneamente cómo estos cambios afectan el valor intrínseco de la mente.
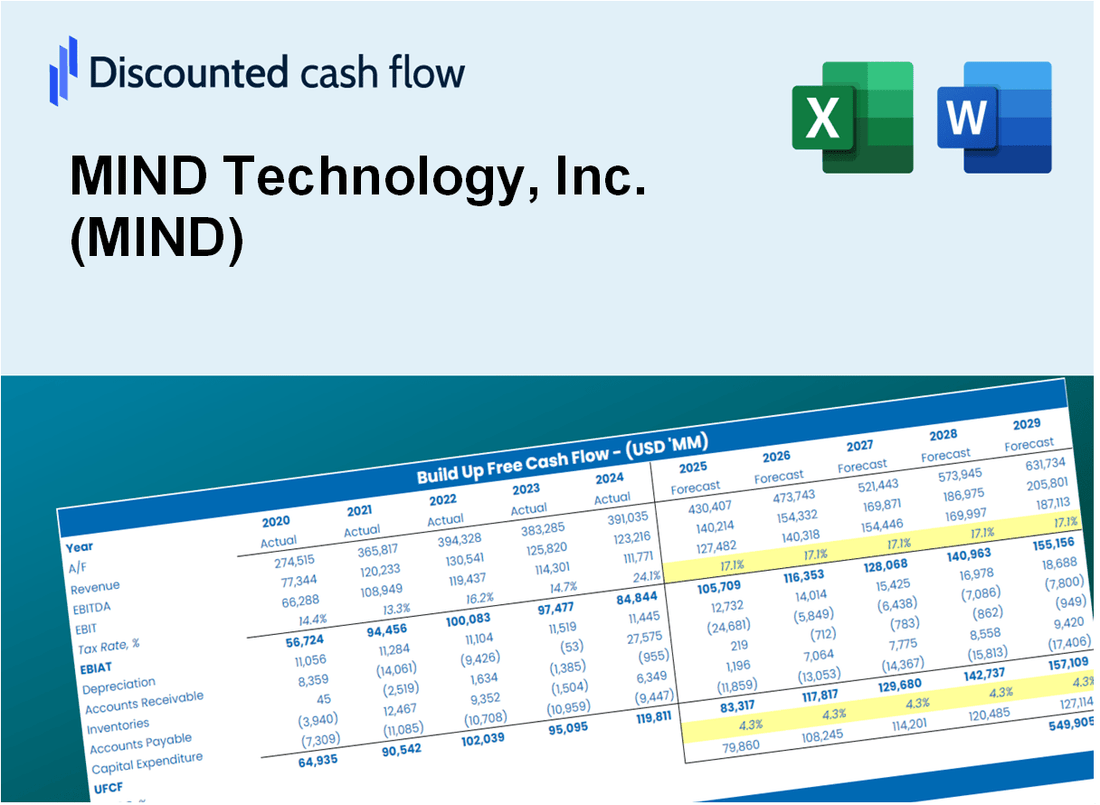
Discounted Cash Flow (DCF) - (USD MM)
| Year | AY1 2020 |
AY2 2021 |
AY3 2022 |
AY4 2023 |
AY5 2024 |
FY1 2025 |
FY2 2026 |
FY3 2027 |
FY4 2028 |
FY5 2029 |
|---|---|---|---|---|---|---|---|---|---|---|
| Revenue | 21.2 | 23.1 | 25.0 | 36.5 | 46.9 | 57.6 | 70.8 | 86.9 | 106.8 | 131.2 |
| Revenue Growth, % | 0 | 8.92 | 8.24 | 45.97 | 28.36 | 22.87 | 22.87 | 22.87 | 22.87 | 22.87 |
| EBITDA | -9.0 | -12.3 | -4.1 | 2.0 | 8.0 | -10.3 | -12.6 | -15.5 | -19.1 | -23.5 |
| EBITDA, % | -42.43 | -53.36 | -16.19 | 5.57 | 17.08 | -17.87 | -17.87 | -17.87 | -17.87 | -17.87 |
| Depreciation | 2.8 | 2.2 | 1.3 | 1.5 | .9 | 3.9 | 4.9 | 6.0 | 7.3 | 9.0 |
| Depreciation, % | 13.18 | 9.56 | 5.37 | 4.15 | 2.01 | 6.86 | 6.86 | 6.86 | 6.86 | 6.86 |
| EBIT | -11.8 | -14.5 | -5.4 | .5 | 7.1 | -14.2 | -17.5 | -21.5 | -26.4 | -32.4 |
| EBIT, % | -55.61 | -62.92 | -21.57 | 1.42 | 15.06 | -24.72 | -24.72 | -24.72 | -24.72 | -24.72 |
| Total Cash | 4.6 | 5.1 | .8 | 5.3 | 5.3 | 8.4 | 10.3 | 12.7 | 15.6 | 19.1 |
| Total Cash, percent | .0 | .0 | .0 | .0 | .0 | .0 | .0 | .0 | .0 | .0 |
| Account Receivables | 4.7 | 8.1 | 4.0 | 6.6 | 11.8 | 13.4 | 16.5 | 20.3 | 24.9 | 30.6 |
| Account Receivables, % | 22.38 | 35.17 | 15.96 | 17.98 | 25.22 | 23.34 | 23.34 | 23.34 | 23.34 | 23.34 |
| Inventories | 11.5 | 14.0 | 15.3 | 13.4 | 13.7 | 27.8 | 34.2 | 42.0 | 51.7 | 63.5 |
| Inventories, % | 53.99 | 60.61 | 61.24 | 36.62 | 29.33 | 48.36 | 48.36 | 48.36 | 48.36 | 48.36 |
| Accounts Payable | 1.7 | 2.0 | 2.5 | 1.6 | 2.6 | 4.2 | 5.2 | 6.4 | 7.9 | 9.6 |
| Accounts Payable, % | 8.03 | 8.85 | 9.97 | 4.45 | 5.46 | 7.35 | 7.35 | 7.35 | 7.35 | 7.35 |
| Capital Expenditure | -.6 | -.8 | -.6 | -.3 | -.4 | -1.2 | -1.5 | -1.8 | -2.2 | -2.7 |
| Capital Expenditure, % | -2.67 | -3.61 | -2.33 | -0.7943 | -0.93251 | -2.07 | -2.07 | -2.07 | -2.07 | -2.07 |
| Tax Rate, % | 28.11 | 28.11 | 28.11 | 28.11 | 28.11 | 28.11 | 28.11 | 28.11 | 28.11 | 28.11 |
| EBITAT | -16.2 | -14.5 | -7.4 | -4.5 | 5.1 | -10.6 | -13.0 | -16.0 | -19.6 | -24.1 |
| Depreciation | ||||||||||
| Changes in Account Receivables | ||||||||||
| Changes in Inventories | ||||||||||
| Changes in Accounts Payable | ||||||||||
| Capital Expenditure | ||||||||||
| UFCF | -28.4 | -18.7 | -3.4 | -4.8 | .9 | -21.9 | -18.1 | -22.2 | -27.3 | -33.6 |
| WACC, % | 6.38 | 6.38 | 6.38 | 6.33 | 6.37 | 6.37 | 6.37 | 6.37 | 6.37 | 6.37 |
| PV UFCF | ||||||||||
| SUM PV UFCF | -101.0 | |||||||||
| Long Term Growth Rate, % | 2.00 | |||||||||
| Free cash flow (T + 1) | -34 | |||||||||
| Terminal Value | -783 | |||||||||
| Present Terminal Value | -575 | |||||||||
| Enterprise Value | -676 | |||||||||
| Net Debt | -4 | |||||||||
| Equity Value | -672 | |||||||||
| Diluted Shares Outstanding, MM | 8 | |||||||||
| Equity Value Per Share | -84.31 |
What You Will Get
- Real MIND Financials: Access to historical and projected data for precise valuation.
- Customizable Inputs: Adjust WACC, tax rates, revenue growth, and capital expenditures as needed.
- Dynamic Calculations: Intrinsic value and NPV are calculated in real-time.
- Scenario Analysis: Evaluate various scenarios to assess MIND Technology's future performance.
- User-Friendly Design: Crafted for professionals while remaining approachable for newcomers.
Key Features
- Comprehensive MIND Data: Pre-loaded with MIND Technology, Inc.'s historical performance metrics and future growth projections.
- Customizable Variables: Modify parameters such as revenue growth rates, profit margins, WACC, tax rates, and capital expenditures.
- Interactive Valuation Model: Automatically recalibrates Net Present Value (NPV) and intrinsic value based on user-defined inputs.
- Scenario Analysis: Develop various forecasting scenarios to evaluate different valuation results.
- Intuitive Interface: Designed for ease of use, making it accessible for both seasoned professionals and newcomers.
How It Works
- 1. Access the Template: Download and open the Excel file containing MIND Technology, Inc.'s preloaded data.
- 2. Modify Assumptions: Adjust key inputs such as growth rates, WACC, and capital expenditures specific to MIND (MIND).
- 3. View Results Instantly: The DCF model automatically calculates intrinsic value and NPV for MIND (MIND).
- 4. Analyze Scenarios: Evaluate multiple forecasts to explore various valuation outcomes for MIND (MIND).
- 5. Present with Confidence: Share professional valuation insights to enhance your decision-making for MIND (MIND).
Why Choose This Calculator for MIND Technology, Inc. (MIND)?
- Accurate Data: Real MIND Technology financials ensure reliable valuation results.
- Customizable: Adjust key parameters like growth rates, WACC, and tax rates to align with your forecasts.
- Time-Saving: Pre-built calculations streamline the process, saving you time and effort.
- Professional-Grade Tool: Tailored for investors, analysts, and consultants focused on MIND.
- User-Friendly: Intuitive design and step-by-step guidance make it accessible for all users.
Who Should Use MIND Technology, Inc. (MIND)?
- Engineering Students: Explore advanced technologies and their applications in real-world scenarios.
- Researchers: Utilize cutting-edge models in your studies or innovative projects.
- Investors: Evaluate your investment strategies and assess the performance of MIND Technology, Inc. (MIND).
- Industry Analysts: Enhance your analysis with a tailored, ready-to-use financial model.
- Entrepreneurs: Understand how technology companies are evaluated in the market.
What the Template Contains
- Operating and Balance Sheet Data: Pre-filled MIND Technology, Inc. (MIND) historical data and forecasts, including revenue, EBITDA, EBIT, and capital expenditures.
- WACC Calculation: A dedicated sheet for Weighted Average Cost of Capital (WACC), including parameters like Beta, risk-free rate, and share price.
- DCF Valuation (Unlevered and Levered): Editable Discounted Cash Flow models showing intrinsic value with detailed calculations.
- Financial Statements: Pre-loaded financial statements (annual and quarterly) to support analysis.
- Key Ratios: Includes profitability, leverage, and efficiency ratios for MIND Technology, Inc. (MIND).
- Dashboard and Charts: Visual summary of valuation outputs and assumptions to analyze results easily.
Disclaimer
All information, articles, and product details provided on this website are for general informational and educational purposes only. We do not claim any ownership over, nor do we intend to infringe upon, any trademarks, copyrights, logos, brand names, or other intellectual property mentioned or depicted on this site. Such intellectual property remains the property of its respective owners, and any references here are made solely for identification or informational purposes, without implying any affiliation, endorsement, or partnership.
We make no representations or warranties, express or implied, regarding the accuracy, completeness, or suitability of any content or products presented. Nothing on this website should be construed as legal, tax, investment, financial, medical, or other professional advice. In addition, no part of this site—including articles or product references—constitutes a solicitation, recommendation, endorsement, advertisement, or offer to buy or sell any securities, franchises, or other financial instruments, particularly in jurisdictions where such activity would be unlawful.
All content is of a general nature and may not address the specific circumstances of any individual or entity. It is not a substitute for professional advice or services. Any actions you take based on the information provided here are strictly at your own risk. You accept full responsibility for any decisions or outcomes arising from your use of this website and agree to release us from any liability in connection with your use of, or reliance upon, the content or products found herein.