
|
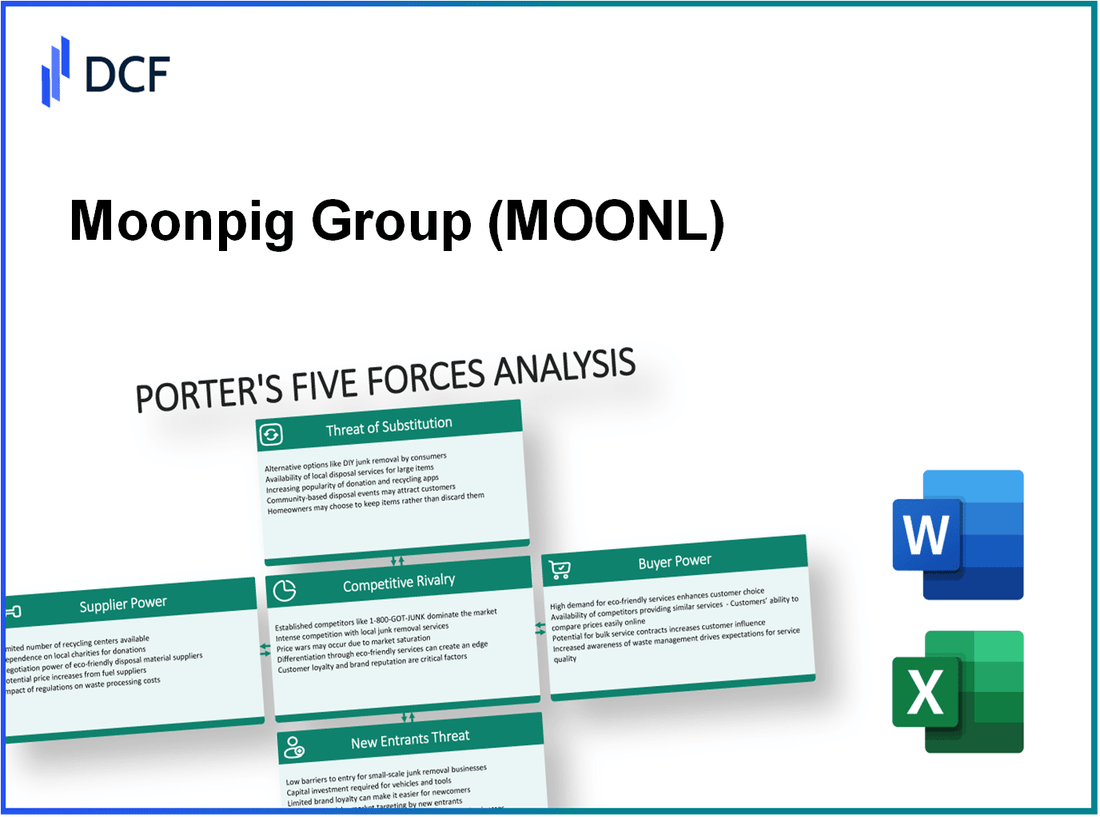
Moonpig Group PLC (MOON.L): 5 FORCES Analysis [Apr-2026 Updated] |
Completamente Editable: Adáptelo A Sus Necesidades En Excel O Sheets
Diseño Profesional: Plantillas Confiables Y Estándares De La Industria
Predeterminadas Para Un Uso Rápido Y Eficiente
Compatible con MAC / PC, completamente desbloqueado
No Se Necesita Experiencia; Fáciles De Seguir
Moonpig Group PLC (MOON.L) Bundle
Moonpig Group sits at the intersection of tradition and tech - dominating the UK online card market with deep customer data, high-margin personalized products and a growing experiences arm, yet squeezed by postage monopolies, cloud dependence and fierce omnichannel rivals; explore how supplier leverage, customer loyalty, competitive rivalry, substitutes and high entry barriers shape its strategy and margins below.
Moonpig Group PLC (MOON.L) - Porter's Five Forces: Bargaining power of suppliers
RELIANCE ON POSTAL SERVICE MONOPOLIES: Moonpig depends heavily on Royal Mail for delivery of its letter-sized greeting cards across the UK. Postage costs represented approximately 25% of the total cost of goods sold for a standard greeting card transaction in 2025. Royal Mail's increase of the first class stamp to £1.65 in late 2024 imposed direct margin pressure that is difficult to negotiate away. The group reported H1 2025 revenue of £162.2m, up 6.6% year-on-year, yet logistics inflation remained a persistent headwind despite volume growth. Moonpig manages over 50 million card orders annually, creating some volume-based leverage, but switching to alternative carriers for letter-sized mail is not currently feasible due to universal service constraints and customer expectation of first-class timing.
| Metric | Value (2025) | Notes |
|---|---|---|
| Postage as % of COGS | 25% | Standard greeting card transaction |
| First class stamp price | £1.65 | Increase implemented late 2024 |
| Annual card orders | 50 million+ | UK and international combined |
| H1 2025 revenue | £162.2m | +6.6% YoY |
DIVERSIFIED GIFTING SUPPLY CHAIN DYNAMICS: Moonpig sources physical gifts and flowers from a network of over 500 third-party suppliers to sustain a 48% gift attachment rate. The 2022 acquisition of Buyagift and Red Letter Days for £124m integrated approximately 4,000 experience partners into the ecosystem, further broadening supplier diversity. No single gift partner contributes more than 5% of total gift revenue, reducing supplier concentration risk and mitigating supplier bargaining power. In fiscal 2025 the group maintained an adjusted EBITDA margin of 29.7%, indicating effective management of supplier input costs and pricing. Moonpig's proprietary platform and merchandising agility enable rapid delisting and replacement of underperforming gift lines to protect gross margins.
| Metric | Value | Notes |
|---|---|---|
| Number of gift suppliers | 500+ | Third-party suppliers for gifts and flowers |
| Experience partners (post-acquisition) | ~4,000 | Buyagift & Red Letter Days integration |
| Gift attachment rate | 48% | Percentage of orders including a gift |
| Max revenue share per supplier | <5% | No single supplier dominant |
| Adjusted EBITDA margin | 29.7% | Fiscal 2025 performance |
- Supplier fragmentation: reduces single-supplier leverage; enables supplier substitution.
- Acquisition-driven integration: increased bargaining power through scale and breadth of offerings.
- Operational agility: merchandising and platform control lower switching friction for Moonpig versus suppliers.
TECHNOLOGY AND CLOUD INFRASTRUCTURE COSTS: Moonpig relies on a small number of hyperscale cloud providers (notably AWS) to host its personalization engine, customer database, and 90 million stored occasions and reminders. Annual technology and data development spend is approximately £20m to support 13 million active customers. These suppliers possess significant bargaining power because migrating large volumes of customer data and platform functionality to an alternate architecture would be extremely costly and operationally risky. Moonpig sustains capital expenditure intensity of around 5% of revenue to keep its internal tech stack modular and reduce vendor lock-in risk. The company targets platform availability of 99.9% during peak periods (e.g., Mother's Day) by optimizing server costs and architecture, partially offsetting cloud provider pricing pressure.
| Metric | Value | Notes |
|---|---|---|
| Annual tech & data spend | £20m | Development and data initiatives |
| Active customers | 13 million | Definition: customers with activity in trailing 12 months |
| Stored occasions & reminders | 90 million | Data migration complexity driver |
| Capex intensity | ~5% of revenue | Maintains modular internal tech stack |
| Target platform availability | 99.9% | Peak-period SLA goal |
- Cloud concentration risk: high switching costs and data migration complexity increase supplier power.
- Mitigants: modular architecture, targeted capex, multi-region deployments, and cost-optimization initiatives.
- Financial impact: rising cloud and postage costs compress gross margins absent offsetting price or efficiency actions.
Moonpig Group PLC (MOON.L) - Porter's Five Forces: Bargaining power of customers
HIGH LOYALTY AMONG ACTIVE CUSTOMER BASE
Moonpig maintains a highly loyal active customer base of 13 million customers, delivering a stable recurring revenue profile where approximately 89% of group revenue is derived from existing customers. The average order value rose to £11.20 in 2025, reflecting effective cross-sell and personalized reminder strategies. The platform stores c.90 million individual birthdays and occasions, creating material psychological switching costs and making one-off switching to competitors less likely. The Moonpig app generates c.40% of total orders, reinforcing convenience and retention versus cheaper physical alternatives.
| Metric | Value |
|---|---|
| Active customers | 13,000,000 |
| Revenue from existing customers | 89% |
| Average order value (2025) | £11.20 |
| Stored occasions/birthdays | 90,000,000 |
| Share of orders via app | 40% |
- High repeat-purchase rate limits individual customer bargaining power.
- Extensive CRM data increases perceived and actual switching costs.
- App-led convenience sustains retention despite lower-priced offline options.
PRICE SENSITIVITY IN DISCRETIONARY SPENDING
Although individual customers' negotiation leverage is low, the aggregate market is price-sensitive amid a UK inflation rate of 2.3%. Moonpig operates a tiered pricing strategy with standard cards around £3.99 to remain competitive with high street rivals. 25% of transactions now include a gift, indicating willingness to spend for convenience; yet churn remains monitored due to competitors such as Card Factory offering cards from £1.20 in store. Moonpig invested £15m in marketing in H1 2025 to reinforce brand value and mitigate price sensitivity.
| Metric | Value |
|---|---|
| UK inflation rate (reference) | 2.3% |
| Standard card price (approx.) | £3.99 |
| Competitor low-price alternative | £1.20 (Card Factory) |
| % transactions including a gift | 25% |
| Marketing spend H1 2025 | £15,000,000 |
- Tiered pricing and add-ons (gifts) reduce price-only comparisons.
- Marketing spend offsets sensitivity and supports perceived value.
- Close monitoring of churn rates required given cheaper offline alternatives.
SUBSCRIPTION MODELS REDUCE CUSTOMER POWER
The Moonpig Plus subscription has materially lowered switching propensity among frequent purchasers. In 2025 Moonpig reported 14% growth in Moonpig Plus members, reaching 500,000 active subscribers. These members pay an upfront fee and typically benefit from perks such as free delivery, a primary driver for c.60% of online shoppers, thereby concentrating spend on the platform. Subscription revenue provides predictable cash flow and reduces the marginal bargaining power of the most valuable cohort.
| Metric | Value |
|---|---|
| Moonpig Plus members (2025) | 500,000 |
| Plus membership growth (2025) | 14% |
| Share of online shoppers citing free delivery as key driver | 60% |
| Impact on churn (qualitative) | Reduced among subscribers |
- Subscription model locks in frequent buyers and smooths revenue.
- Upfront fees and delivery benefits raise effective switching costs.
- Subscriptions concentrate customer spend and diminish aggregate bargaining power.
Moonpig Group PLC (MOON.L) - Porter's Five Forces: Competitive rivalry
INTENSE COMPETITION WITHIN THE ONLINE SEGMENT: Moonpig holds an estimated 60% share of the UK online greeting card market but faces aggressive rivals including Funky Pigeon and Thortful. Funky Pigeon, owned by WH Smith, leverages a physical retail network of over 1,100 stores to drive omnichannel traffic and brand visibility. In response Moonpig has increased technology and data investment to approximately £20.0m annually to maintain leadership in personalization and recommendation engines.
The competitive landscape is marked by high marketing intensity. Moonpig allocates roughly 10% of revenue to customer acquisition, reflecting substantial spend on paid search, social and affiliate channels. In 2025 Moonpig reported a 14% growth in its subscription base, strengthening recurring revenue and creating a defensive moat against customer churn and competitor poaching.
Key competitive metrics:
| Metric | Moonpig | Funky Pigeon | Thortful | Card Factory |
|---|---|---|---|---|
| UK online market share (est.) | 60% | 20% | 5% | - |
| Physical retail footprint | Online-first | 1,100 stores (WH Smith network) | Online/marketplaces | ~850 stores |
| Annual tech & data investment | £20.0m | £8-12m (est.) | £2-4m (est.) | £5-8m (est.) |
| Marketing as % of revenue | ~10% | ~9% (est.) | ~15% (est.) | ~6% (est.) |
| 2025 subscription base growth | +14% | +7% (est.) | +3% (est.) | +6% |
MARKET FRAGMENTATION ACROSS PHYSICAL RETAIL: The total UK greeting card market is estimated at £1.3bn and remains highly fragmented. Card Factory holds an approximate 30% volume share of the broader physical market and reported a 6% revenue increase in 2025, underlining the resilience of brick-and-mortar models despite the ongoing digital shift.
Moonpig leverages assortment breadth and unit economics to compete with physical retailers. The group offers over 30,000 unique card designs - a SKU depth physical stores cannot match due to shelf space constraints. Moonpig reports gross margins on cards around 70%, materially higher than the ~35% typical in traditional retail, enabling greater marketing and product investment.
- Product breadth: >30,000 SKUs (Moonpig) vs ~1,000-5,000 SKU limits in typical stores.
- Gross margin: Moonpig ~70% vs physical retail ~35%.
- Pricing flexibility: dynamic pricing and bundling enabled by e-commerce platform.
DATA-DRIVEN PERSONALIZATION AS A DIFFERENTIATOR: Moonpig's database of approximately 90 million recorded occasions enables personalized reminders and targeted offers at scale. This data advantage translates into higher engagement and repeat purchase rates that competitors struggle to replicate.
Moonpig's data-driven approach delivered 6.6% revenue growth in late 2025 despite a broadly stagnant retail sector. The company applies machine learning to gift suggestion and cross-sell engines, achieving a 48% gift attachment rate within the Moonpig brand segment, materially increasing average order value (AOV).
Competitor positioning:
| Competitive dimension | Moonpig | Thortful | Funky Pigeon |
|---|---|---|---|
| Historical purchase data | ~90m occasions (rich dataset) | Limited, designer-focused | Moderate, linked to WH Smith customer data |
| Gift attachment rate | 48% | ~20% (est.) | ~35% (est.) |
| Revenue growth late 2025 | +6.6% | ~+2-4% (est.) | ~+5% (est.) |
| Net debt / EBITDA | 1.3x | - | - |
Balance sheet strength (net debt to EBITDA ~1.3x) provides Moonpig with financial flexibility to sustain investment in personalization, marketing and UX improvements, reinforcing its competitive advantages and raising barriers to entry for smaller rivals that lack scale or capital.
Moonpig Group PLC (MOON.L) - Porter's Five Forces: Threat of substitutes
RISE OF DIGITAL AND SOCIAL MEDIA ALTERNATIVES: The proliferation of free digital alternatives (WhatsApp, Instagram, Facebook, Snapchat) exerts continuous downward pressure on demand for physical greeting cards. The UK market still sends approximately 1.5 billion physical cards annually, but digital substitution is accelerating among younger cohorts. Moonpig has responded by integrating digital capabilities - its e-card volume grew ~15% year-on-year - while recognizing e-cards generate materially lower revenue per unit than physical cards (estimated average revenue per e-card ~£0.60 vs physical card + gift attachment driving average order values substantially higher).
Market segmentation data indicate that roughly 20% of Gen Z consumers prefer digital-only greetings, creating an expanding addressable segment for digital substitutes. Moonpig's product innovation includes video-integrated cards and personalization features designed to preserve emotional engagement. The company reports a 48% gift attachment rate (customers adding a gift to a card purchase), a key metric used to differentiate from purely digital substitutes by reinforcing the value of a physical present alongside a card.
| Metric | Physical Cards (UK) | E-cards (Moonpig) | Gen Z Preference |
|---|---|---|---|
| Annual volume | 1.5 billion | Moonpig e-card volume, YoY +15% | 20% prefer digital-only |
| Avg revenue per unit | Higher (card + gift options) | ~£0.60 (estimated) | NA |
| Gift attachment rate | Industry-varies | Moonpig 48% | NA |
| Strategic response | Physical product focus | Digital features, video cards | Targeted digital offerings |
Key defensive actions taken by Moonpig against digital substitutes include:
- Investing in video-integrated e-cards and enhanced personalization to increase emotional value of digital products.
- Upselling gifts and experiences at point of purchase to maintain higher average order value.
- Marketing campaigns targeted at Gen Z to convert digital-first consumers into hybrid buyers.
EXPERIENCE BASED GIFTING AS A SUBSTITUTE: Experience gifting (events, activities, travel vouchers) is growing faster than traditional material gifts. Moonpig's acquisition of an Experiences division for £124 million positions the group to capture shifting consumer spend. The Experiences segment contributes approximately 15% of total group revenue, providing a meaningful hedge against slowing physical card volumes.
The broader experience market is expanding at ~7% annually versus ~2% growth for the traditional greeting card sector. Moonpig leverages platform data and its customer base (circa 13 million active customers) to suggest over 4,000 different experiences at point of card purchase, increasing cross-sell conversion and average order value. This strategic pivot aligns Moonpig with higher-growth categories and reduces revenue exposure to pure card volume declines.
| Metric | Experiences | Traditional Greeting Cards |
|---|---|---|
| Acquisition cost | £124 million | N/A |
| Revenue contribution | ~15% of group revenue | Majority remainder |
| Market growth rate | ~7% p.a. | ~2% p.a. |
| Product SKUs suggested | 4,000+ experiences | Thousands of card designs |
| Active customer base | 13 million | 13 million |
Strategic levers to mitigate experience-based substitution:
- Cross-selling experiences at checkout to lock-in spend within the Moonpig ecosystem.
- Personalization engines recommending experiences based on recipient data and purchase history.
- Bundling physical cards with experience vouchers to preserve relevance of cards.
DIRECT TO CONSUMER FLORAL COMPETITION: Specialist online florists (e.g., Bloom & Wild and others) pose a substitute to card-plus-gift bundles by offering direct flower delivery. Moonpig has scaled in-house floral operations to capture this segment; flowers now account for nearly 10% of Moonpig's gifting revenue. Operational improvements include a just-in-time supply chain, regional fulfilment to maintain freshness, and pricing strategies to compete with specialist retailers.
During peak periods (Valentine's Day, Mother's Day), Moonpig demonstrates capacity to capture substitute demand - processing over 200,000 flower orders at peak and using promotional bundles to increase uplift in card and gift attachments. Offering a single checkout for cards, gifts, flowers and experiences reduces customer incentive to visit specialist substitutes and increases customer lifetime value.
| Metric | Moonpig Floral | Specialist Florists |
|---|---|---|
| Revenue share (gifting) | ~10% | Varies |
| Peak day orders | >200,000 (Valentine's Day) | Varies by specialist |
| Supply approach | Just-in-time, regional fulfilment | Specialist grower networks |
| Customer advantage | One-stop shop | Category expertise |
Competitive responses to floral substitutes include:
- Integrating flowers into bundled offers with cards and experiences to raise basket size.
- Optimising supply chain to reduce waste and match price points of specialist florists.
- Promotional cadence timed to peak gifting occasions to win incremental share.
Moonpig Group PLC (MOON.L) - Porter's Five Forces: Threat of new entrants
HIGH BARRIERS CREATED BY MARKETING COSTS - New entrants face significant hurdles in the mature UK greeting card and online gifting market due to the scale of marketing investment required to acquire and retain customers. Moonpig spends approximately £35 million annually on marketing to sustain brand awareness and protect a c.60% online market share. With ~13 million active users on its platform, an entrant seeking a modest 5% share would need to attract ~650,000 users, implying customer acquisition expenditures likely in the tens of millions GBP in the short term. Moonpig reported a marketing-to-revenue ratio of ~10%, a level that early-stage competitors typically cannot sustain without substantial venture capital or strategic backers.
| Metric | Moonpig (reported) | Implication for New Entrants |
|---|---|---|
| Annual marketing spend | £35,000,000 | High fixed marketing requirement; heavy upfront investment |
| Online market share (UK) | ~60% | Large incumbent advantage; difficult to displace |
| Active users | 13,000,000 | Scale of user base creates high acquisition cost target |
| Target share for modest entrant | 5% (~650,000 users) | Requires multi-million pound marketing budget |
| Marketing-to-revenue ratio | ~10% | Benchmark that investors expect; difficult for startups |
| Customer-date dataset | 90,000,000 customer dates | Data moat driving personalized engagement |
The accumulated dataset of ~90 million customer dates functions as a significant data moat that confers advantages in targeting, personalization, and lifetime value optimization. New entrants cannot easily replicate this behavioral and transactional history, increasing the effective cost and time window required to reach parity in customer relevance and retention.
ECONOMIES OF SCALE IN PRODUCTION AND LOGISTICS - Moonpig's automated production and logistics network delivers material per-unit cost advantages. The group operates high-throughput print and fulfillment facilities (including a £15 million investment in a Dutch production hub following 2025 expansion) that enable it to print and ship millions of personalized cards at gross margins of ~70%. Annual spend on postage and logistics runs into the tens of millions GBP, allowing Moonpig to negotiate preferential carrier rates that smaller rivals cannot access.
| Production & Logistics Metric | Moonpig Data | Barrier Effect |
|---|---|---|
| Gross margin on core products | ~70% | High profitability per unit; room to subsidize acquisition |
| Adjusted EBITDA margin | 29.7% | Superior cash generation vs. startups |
| Investment in European production | £15,000,000 (Dutch hub, 2025) | Improved cross-border efficiency and cost base |
| Annual postage/logistics spend | Tens of millions GBP | Leverage in carrier negotiations; lower unit costs |
| Supplier scale | Bulk procurement of paper, ink, packaging | Lower input costs vs. small rivals |
Smaller rivals face materially higher per-unit costs for paper, ink, and shipping and lack the throughput to justify automation investment, constraining their ability to compete on price or margin. The scale advantages support Moonpig's ability to sustain promotional activity and product innovation without eroding profitability to startup levels.
COMPLEXITY OF PROPRIETARY TECHNOLOGY PLATFORMS - The technological platform required to manage ~30,000 designs, 13 million user profiles, and real-time personalization is capital- and expertise-intensive. Moonpig has cumulatively invested over £100 million into its technology stack to enable seamless integration between mobile/web ordering and production facilities. The Moonpig app generates ~40% of all orders and maintains a high user experience with a 4.8-star app-store rating, necessitating continuous development, monitoring, and support.
- Platform scale: ~30,000 designs; dynamic personalization engines.
- User base: ~13,000,000 profiles with purchase histories and preferences.
- App penetration: ~40% of orders; 4.8-star rating requiring ongoing UX investment.
- Supplier network: ~4,000 experience partners integrated into the marketplace.
- Cumulative technology spend: >£100,000,000.
New entrants must not only build comparable front-end and personalization capabilities but also integrate with logistics and supplier networks (c.4,000 partners) to deliver the product breadth and fulfillment reliability customers expect. The capital intensity, engineering talent, and time-to-market required create a substantial deterrent to entry.
Combined, high marketing costs, production and logistics economies of scale, and the complexity of Moonpig's proprietary technology platform form a robust set of entry barriers. These factors make the threat of new entrants low-to-moderate in practical terms despite the attractiveness of the online gifting category.
Disclaimer
All information, articles, and product details provided on this website are for general informational and educational purposes only. We do not claim any ownership over, nor do we intend to infringe upon, any trademarks, copyrights, logos, brand names, or other intellectual property mentioned or depicted on this site. Such intellectual property remains the property of its respective owners, and any references here are made solely for identification or informational purposes, without implying any affiliation, endorsement, or partnership.
We make no representations or warranties, express or implied, regarding the accuracy, completeness, or suitability of any content or products presented. Nothing on this website should be construed as legal, tax, investment, financial, medical, or other professional advice. In addition, no part of this site—including articles or product references—constitutes a solicitation, recommendation, endorsement, advertisement, or offer to buy or sell any securities, franchises, or other financial instruments, particularly in jurisdictions where such activity would be unlawful.
All content is of a general nature and may not address the specific circumstances of any individual or entity. It is not a substitute for professional advice or services. Any actions you take based on the information provided here are strictly at your own risk. You accept full responsibility for any decisions or outcomes arising from your use of this website and agree to release us from any liability in connection with your use of, or reliance upon, the content or products found herein.