
|
Valoración de DCF de Morgan Stanley Direct Lending Fund (MSDL) |
Completamente Editable: Adáptelo A Sus Necesidades En Excel O Sheets
Diseño Profesional: Plantillas Confiables Y Estándares De La Industria
Predeterminadas Para Un Uso Rápido Y Eficiente
Compatible con MAC / PC, completamente desbloqueado
No Se Necesita Experiencia; Fáciles De Seguir
Morgan Stanley Direct Lending Fund (MSDL) Bundle
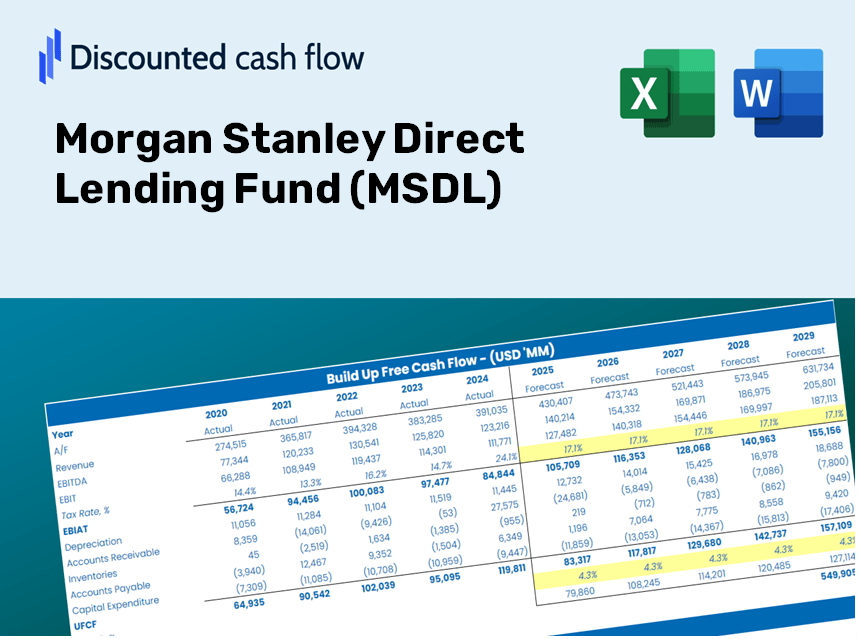
Engerrado para su precisión, nuestra calculadora DCF (MSDL) le permite evaluar la valoración del Fondo de Préstamos Directos Morgan Stanley utilizando datos financieros en tiempo real, con una flexibilidad completa para modificar todos los parámetros clave para las proyecciones mejoradas.
Benefits You Will Receive
- Authentic MSDL Financial Data: Featuring comprehensive historical and projected information for thorough analysis.
- Customizable Template: Easily adjust key variables such as loan terms, interest rates, and projected returns.
- Instant Calculations: Watch MSDL's intrinsic value refresh dynamically with your input changes.
- Expert Valuation Tool: Tailored for investors, analysts, and consultants in search of reliable DCF outcomes.
- Intuitive Interface: Straightforward layout and clear guidance suitable for users of all skill levels.
Highlighted Features
- Authentic Financial Data: Gain access to precise historical data and forward-looking projections for Morgan Stanley Direct Lending Fund (MSDL).
- Adjustable Forecast Parameters: Modify highlighted fields such as WACC, growth rates, and profit margins.
- Real-Time Calculations: Enjoy automatic updates to DCF, Net Present Value (NPV), and cash flow assessments.
- Interactive Dashboard: View intuitive charts and summaries to clearly understand your valuation outcomes.
- Designed for All Levels: A user-friendly layout tailored for investors, CFOs, and consultants alike.
How It Functions
- 1. Access the Template: Download and open the Excel file containing preloaded data for Morgan Stanley Direct Lending Fund (MSDL).
- 2. Modify Assumptions: Adjust key variables such as interest rates, risk premiums, and investment amounts.
- 3. View Instant Results: The DCF model automatically calculates the intrinsic value and net present value (NPV).
- 4. Explore Scenarios: Evaluate various forecasts to understand different valuation possibilities.
- 5. Utilize with Assurance: Deliver expert valuation insights to reinforce your financial decisions.
Why Opt for the Morgan Stanley Direct Lending Fund (MSDL)?
- User-Friendly Interface: Suitable for both novice and seasoned investors.
- Customizable Inputs: Effortlessly adjust parameters to suit your investment analysis.
- Real-Time Adjustments: Observe immediate changes in valuation as you modify inputs.
- Preloaded Data: Equipped with actual financial metrics for swift evaluations.
- Relied Upon by Experts: Preferred by investors and analysts for data-driven decision-making.
Who Can Benefit from This Product?
- Investors: Determine the intrinsic value of Morgan Stanley Direct Lending Fund (MSDL) prior to making investment choices.
- CFOs: Utilize a top-tier DCF model for comprehensive financial analysis and reporting.
- Consultants: Seamlessly customize the template for client valuation reports.
- Entrepreneurs: Discover financial modeling strategies employed by leading firms in the industry.
- Educators: Implement it as an educational resource to illustrate valuation techniques.
Contents of the Template
- Preloaded MSDL Data: Historical and projected financial metrics, including revenue, net income, and investment allocations.
- DCF and WACC Models: Advanced sheets for determining intrinsic value and the Weighted Average Cost of Capital.
- Editable Inputs: Yellow-highlighted fields for customizing growth rates, tax assumptions, and discount factors.
- Financial Statements: Detailed annual and quarterly financial reports for in-depth evaluation.
- Key Ratios: Metrics on profitability, leverage, and operational efficiency to assess performance.
- Dashboard and Charts: Visual representations of valuation conclusions and underlying assumptions.
Disclaimer
All information, articles, and product details provided on this website are for general informational and educational purposes only. We do not claim any ownership over, nor do we intend to infringe upon, any trademarks, copyrights, logos, brand names, or other intellectual property mentioned or depicted on this site. Such intellectual property remains the property of its respective owners, and any references here are made solely for identification or informational purposes, without implying any affiliation, endorsement, or partnership.
We make no representations or warranties, express or implied, regarding the accuracy, completeness, or suitability of any content or products presented. Nothing on this website should be construed as legal, tax, investment, financial, medical, or other professional advice. In addition, no part of this site—including articles or product references—constitutes a solicitation, recommendation, endorsement, advertisement, or offer to buy or sell any securities, franchises, or other financial instruments, particularly in jurisdictions where such activity would be unlawful.
All content is of a general nature and may not address the specific circumstances of any individual or entity. It is not a substitute for professional advice or services. Any actions you take based on the information provided here are strictly at your own risk. You accept full responsibility for any decisions or outcomes arising from your use of this website and agree to release us from any liability in connection with your use of, or reliance upon, the content or products found herein.