
|
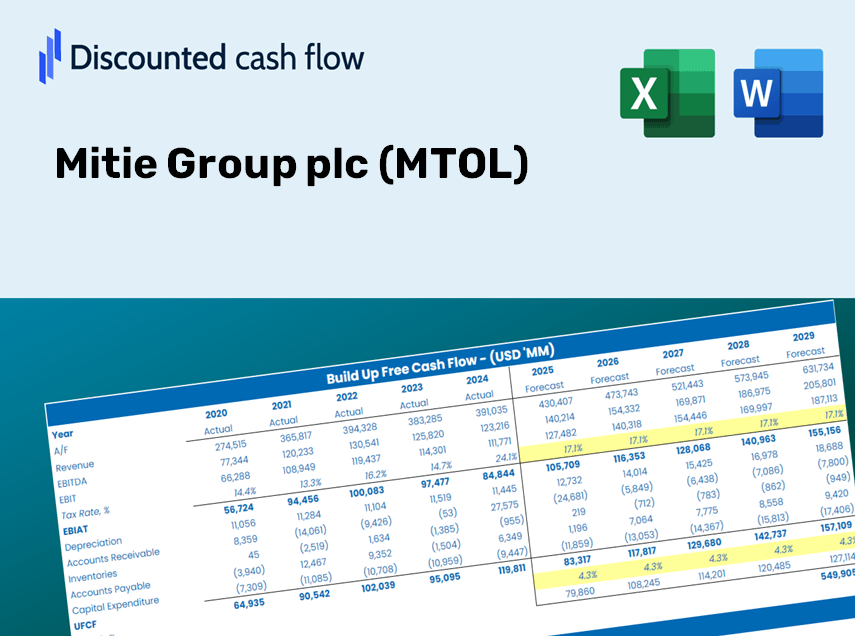
Mitie Group Plc (MTO.L) Valoración de DCF |
Completamente Editable: Adáptelo A Sus Necesidades En Excel O Sheets
Diseño Profesional: Plantillas Confiables Y Estándares De La Industria
Predeterminadas Para Un Uso Rápido Y Eficiente
Compatible con MAC / PC, completamente desbloqueado
No Se Necesita Experiencia; Fáciles De Seguir
Mitie Group plc (MTO.L) Bundle
¿Busca determinar el valor intrínseco de Mitie Group PLC? Nuestra calculadora DCF (MTOL) integra datos del mundo real con características integrales de personalización, lo que le permite ajustar los pronósticos y mejorar sus estrategias de inversión.
Discounted Cash Flow (DCF) - (USD MM)
| Year | AY1 2021 |
AY2 2022 |
AY3 2023 |
AY4 2024 |
AY5 2025 |
FY1 2026 |
FY2 2027 |
FY3 2028 |
FY4 2029 |
FY5 2030 |
|---|---|---|---|---|---|---|---|---|---|---|
| Revenue | 2,499.0 | 3,903.3 | 3,945.0 | 4,445.2 | 5,082.6 | 6,153.5 | 7,450.1 | 9,019.8 | 10,920.3 | 13,221.3 |
| Revenue Growth, % | 0 | 56.19 | 1.07 | 12.68 | 14.34 | 21.07 | 21.07 | 21.07 | 21.07 | 21.07 |
| EBITDA | 54.6 | 137.5 | 205.0 | 249.7 | 269.7 | 268.6 | 325.2 | 393.8 | 476.7 | 577.2 |
| EBITDA, % | 2.18 | 3.52 | 5.2 | 5.62 | 5.31 | 4.37 | 4.37 | 4.37 | 4.37 | 4.37 |
| Depreciation | 51.8 | 70.3 | 72.3 | 81.2 | 106.0 | 118.4 | 143.3 | 173.5 | 210.1 | 254.3 |
| Depreciation, % | 2.07 | 1.8 | 1.83 | 1.83 | 2.09 | 1.92 | 1.92 | 1.92 | 1.92 | 1.92 |
| EBIT | 2.8 | 67.2 | 132.7 | 168.5 | 163.7 | 150.3 | 181.9 | 220.2 | 266.6 | 322.8 |
| EBIT, % | 0.11204 | 1.72 | 3.36 | 3.79 | 3.22 | 2.44 | 2.44 | 2.44 | 2.44 | 2.44 |
| Total Cash | 196.2 | 345.2 | 248.3 | 244.9 | 176.1 | 393.4 | 476.3 | 576.6 | 698.1 | 845.2 |
| Total Cash, percent | .0 | .0 | .0 | .0 | .0 | .0 | .0 | .0 | .0 | .0 |
| Account Receivables | 362.4 | 386.3 | 450.8 | 776.1 | 968.6 | 890.3 | 1,077.9 | 1,305.0 | 1,580.0 | 1,912.9 |
| Account Receivables, % | 14.5 | 9.9 | 11.43 | 17.46 | 19.06 | 14.47 | 14.47 | 14.47 | 14.47 | 14.47 |
| Inventories | 12.7 | 11.9 | 13.5 | 14.7 | 14.9 | 21.9 | 26.5 | 32.1 | 38.9 | 47.0 |
| Inventories, % | 0.5082 | 0.30487 | 0.34221 | 0.33069 | 0.29316 | 0.35583 | 0.35583 | 0.35583 | 0.35583 | 0.35583 |
| Accounts Payable | 127.6 | 134.8 | 229.7 | 171.6 | 1,012.6 | 469.7 | 568.7 | 688.5 | 833.6 | 1,009.2 |
| Accounts Payable, % | 5.11 | 3.45 | 5.82 | 3.86 | 19.92 | 7.63 | 7.63 | 7.63 | 7.63 | 7.63 |
| Capital Expenditure | -21.7 | -35.6 | -25.2 | -11.5 | -31.6 | -40.6 | -49.2 | -59.5 | -72.1 | -87.3 |
| Capital Expenditure, % | -0.86835 | -0.91205 | -0.63878 | -0.25871 | -0.62173 | -0.65992 | -0.65992 | -0.65992 | -0.65992 | -0.65992 |
| Tax Rate, % | 30.26 | 30.26 | 30.26 | 30.26 | 30.26 | 30.26 | 30.26 | 30.26 | 30.26 | 30.26 |
| EBITAT | 1.6 | 52.7 | 124.4 | 136.2 | 114.2 | 113.9 | 137.9 | 166.9 | 202.1 | 244.6 |
| Depreciation | ||||||||||
| Changes in Account Receivables | ||||||||||
| Changes in Inventories | ||||||||||
| Changes in Accounts Payable | ||||||||||
| Capital Expenditure | ||||||||||
| UFCF | -215.8 | 71.5 | 200.3 | -178.7 | 836.9 | -280.0 | 138.8 | 168.0 | 203.4 | 246.3 |
| WACC, % | 7.36 | 7.53 | 7.65 | 7.55 | 7.46 | 7.51 | 7.51 | 7.51 | 7.51 | 7.51 |
| PV UFCF | ||||||||||
| SUM PV UFCF | 318.6 | |||||||||
| Long Term Growth Rate, % | 3.00 | |||||||||
| Free cash flow (T + 1) | 254 | |||||||||
| Terminal Value | 5,625 | |||||||||
| Present Terminal Value | 3,917 | |||||||||
| Enterprise Value | 4,235 | |||||||||
| Net Debt | 199 | |||||||||
| Equity Value | 4,036 | |||||||||
| Diluted Shares Outstanding, MM | 1,339 | |||||||||
| Equity Value Per Share | 301.39 |
Benefits You Will Receive
- Comprehensive MTOL Financials: Access to both historical and predictive data for precise valuation.
- Customizable Inputs: Adjust WACC, tax rates, revenue growth, and capital expenditures as needed.
- Real-Time Calculations: Automatic computation of intrinsic value and NPV.
- Scenario Analysis: Evaluate various scenarios to analyze Mitie Group plc's future performance.
- User-Friendly Design: Designed for industry professionals while remaining accessible to novices.
Key Features
- Comprehensive Mitie Financials: Gain access to precise pre-loaded historical data and forward-looking projections for Mitie Group plc (MTOL).
- Tailorable Forecast Assumptions: Modify yellow-highlighted cells, including WACC, growth rates, and profit margins.
- Real-Time Calculations: Enjoy automatic updates for DCF, Net Present Value (NPV), and cash flow assessments.
- Interactive Dashboard: Utilize clear charts and summaries to effectively visualize your valuation findings.
- Designed for All Skill Levels: An intuitive layout created for investors, CFOs, and consultants, whether seasoned or new to the field.
How It Functions
- Step 1: Download the Excel file.
- Step 2: Examine the pre-filled Mitie Group plc (MTOL) data (both historical and projected).
- Step 3: Modify key assumptions (highlighted in yellow) according to your analysis.
- Step 4: Observe the automatic recalculations of Mitie Group plc’s (MTOL) intrinsic value.
- Step 5: Utilize the results for making investment decisions or for reporting purposes.
Why Choose This Calculator for Mitie Group plc (MTOL)?
- Accurate Data: Utilize genuine Mitie financials for trustworthy valuation outcomes.
- Customizable: Tailor critical factors such as growth rates, WACC, and tax rates to align with your forecasts.
- Time-Saving: Ready-made calculations streamline the process, saving you from starting from the beginning.
- Professional-Grade Tool: Crafted for investors, analysts, and consultants focused on Mitie Group plc (MTOL).
- User-Friendly: A straightforward design and clear, step-by-step guidance make it accessible for all users.
Who Can Benefit from This Product?
- Individual Investors: Gain insights to make informed decisions regarding buying or selling Mitie Group plc (MTOL) stock.
- Financial Analysts: Enhance valuation processes with accessible, ready-to-use financial models tailored for Mitie Group plc (MTOL).
- Consultants: Provide clients with precise and timely valuation insights for Mitie Group plc (MTOL).
- Business Owners: Learn how large corporations like Mitie Group plc (MTOL) are valued to inform your strategic planning.
- Finance Students: Explore valuation techniques through real-world data and scenarios involving Mitie Group plc (MTOL).
Contents of the Template
- Historical Data: A compilation of Mitie Group plc's (MTOL) previous financial figures and foundational forecasts.
- DCF and Levered DCF Models: Comprehensive templates designed to assess the intrinsic value of Mitie Group plc (MTOL).
- WACC Sheet: Pre-configured calculations for the Weighted Average Cost of Capital.
- Editable Inputs: Customize essential parameters such as growth rates, EBITDA %, and CAPEX assumptions.
- Quarterly and Annual Statements: A thorough overview of Mitie Group plc's (MTOL) financial performance.
- Interactive Dashboard: Explore valuation results and forecasts in a dynamic visual format.
Disclaimer
All information, articles, and product details provided on this website are for general informational and educational purposes only. We do not claim any ownership over, nor do we intend to infringe upon, any trademarks, copyrights, logos, brand names, or other intellectual property mentioned or depicted on this site. Such intellectual property remains the property of its respective owners, and any references here are made solely for identification or informational purposes, without implying any affiliation, endorsement, or partnership.
We make no representations or warranties, express or implied, regarding the accuracy, completeness, or suitability of any content or products presented. Nothing on this website should be construed as legal, tax, investment, financial, medical, or other professional advice. In addition, no part of this site—including articles or product references—constitutes a solicitation, recommendation, endorsement, advertisement, or offer to buy or sell any securities, franchises, or other financial instruments, particularly in jurisdictions where such activity would be unlawful.
All content is of a general nature and may not address the specific circumstances of any individual or entity. It is not a substitute for professional advice or services. Any actions you take based on the information provided here are strictly at your own risk. You accept full responsibility for any decisions or outcomes arising from your use of this website and agree to release us from any liability in connection with your use of, or reliance upon, the content or products found herein.