
|
Valoración DCF de MasTec, Inc. (MTZ) |
Completamente Editable: Adáptelo A Sus Necesidades En Excel O Sheets
Diseño Profesional: Plantillas Confiables Y Estándares De La Industria
Predeterminadas Para Un Uso Rápido Y Eficiente
Compatible con MAC / PC, completamente desbloqueado
No Se Necesita Experiencia; Fáciles De Seguir
MasTec, Inc. (MTZ) Bundle
¡Explore el potencial financiero de Mastec, Inc. (MTZ) con nuestra calculadora DCF fácil de usar! Simplemente ingrese sus suposiciones con respecto al crecimiento, los márgenes y los costos para calcular el valor intrínseco de Mastec, Inc. (MTZ) y refinar su estrategia de inversión.
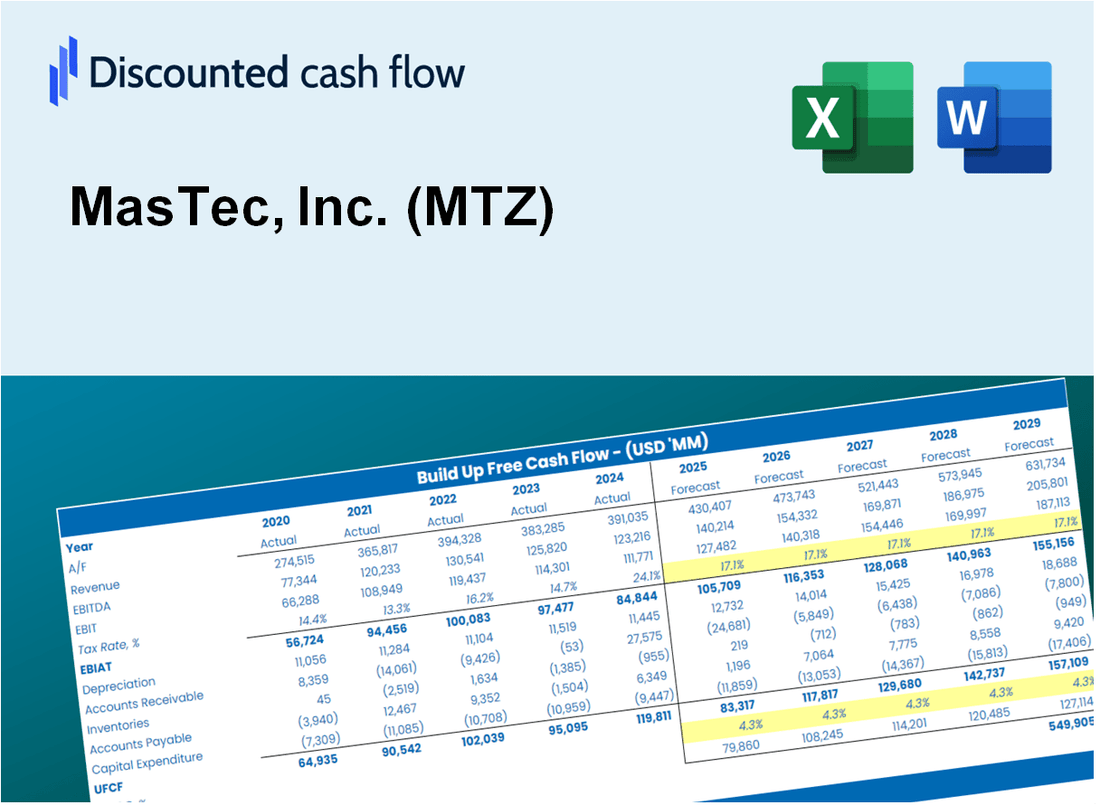
Discounted Cash Flow (DCF) - (USD MM)
| Year | AY1 2020 |
AY2 2021 |
AY3 2022 |
AY4 2023 |
AY5 2024 |
FY1 2025 |
FY2 2026 |
FY3 2027 |
FY4 2028 |
FY5 2029 |
|---|---|---|---|---|---|---|---|---|---|---|
| Revenue | 6,321.0 | 7,951.8 | 9,778.0 | 11,995.9 | 12,303.5 | 14,580.0 | 17,277.7 | 20,474.7 | 24,263.1 | 28,752.6 |
| Revenue Growth, % | 0 | 25.8 | 22.97 | 22.68 | 2.56 | 18.5 | 18.5 | 18.5 | 18.5 | 18.5 |
| EBITDA | 730,904.0 | 906.3 | 662.5 | 754.9 | 950.8 | 3,854.8 | 4,568.0 | 5,413.2 | 6,414.9 | 7,601.8 |
| EBITDA, % | 11563.15 | 11.4 | 6.77 | 6.29 | 7.73 | 26.44 | 26.44 | 26.44 | 26.44 | 26.44 |
| Depreciation | 297.8 | 422.8 | 507.1 | 603.2 | 506.6 | 710.3 | 841.8 | 997.5 | 1,182.1 | 1,400.8 |
| Depreciation, % | 4.71 | 5.32 | 5.19 | 5.03 | 4.12 | 4.87 | 4.87 | 4.87 | 4.87 | 4.87 |
| EBIT | 730,606.2 | 483.5 | 155.3 | 151.7 | 444.2 | 3,281.8 | 3,889.0 | 4,608.6 | 5,461.3 | 6,471.9 |
| EBIT, % | 11558.44 | 6.08 | 1.59 | 1.26 | 3.61 | 22.51 | 22.51 | 22.51 | 22.51 | 22.51 |
| Total Cash | 423.1 | 360.7 | 370.6 | 529.6 | 399.9 | 661.5 | 783.9 | 928.9 | 1,100.8 | 1,304.5 |
| Total Cash, percent | .0 | .0 | .0 | .0 | .0 | .0 | .0 | .0 | .0 | .0 |
| Account Receivables | 1,754.2 | 2,247.2 | 3,129.6 | 3,126.5 | 2,937.3 | 4,022.8 | 4,767.2 | 5,649.2 | 6,694.5 | 7,933.2 |
| Account Receivables, % | 27.75 | 28.26 | 32.01 | 26.06 | 23.87 | 27.59 | 27.59 | 27.59 | 27.59 | 27.59 |
| Inventories | 89.6 | 92.6 | 118.0 | 108.1 | 107.3 | 162.2 | 192.2 | 227.8 | 270.0 | 319.9 |
| Inventories, % | 1.42 | 1.16 | 1.21 | 0.90152 | 0.87248 | 1.11 | 1.11 | 1.11 | 1.11 | 1.11 |
| Accounts Payable | 571.3 | 663.1 | 1,109.9 | 1,242.6 | 1,105.7 | 1,401.8 | 1,661.2 | 1,968.5 | 2,332.8 | 2,764.4 |
| Accounts Payable, % | 9.04 | 8.34 | 11.35 | 10.36 | 8.99 | 9.61 | 9.61 | 9.61 | 9.61 | 9.61 |
| Capital Expenditure | -213.7 | -170.1 | -263.4 | -192.9 | -148.9 | -321.7 | -381.2 | -451.7 | -535.3 | -634.4 |
| Capital Expenditure, % | -3.38 | -2.14 | -2.69 | -1.61 | -1.21 | -2.21 | -2.21 | -2.21 | -2.21 | -2.21 |
| Tax Rate, % | 35.13 | 35.13 | 35.13 | 35.13 | 35.13 | 35.13 | 35.13 | 35.13 | 35.13 | 35.13 |
| EBITAT | 554,785.4 | 369.7 | 120.3 | 91.6 | 288.2 | 2,330.8 | 2,762.1 | 3,273.2 | 3,878.8 | 4,596.5 |
| Depreciation | ||||||||||
| Changes in Account Receivables | ||||||||||
| Changes in Inventories | ||||||||||
| Changes in Accounts Payable | ||||||||||
| Capital Expenditure | ||||||||||
| UFCF | 553,596.8 | 218.3 | -96.8 | 647.5 | 699.0 | 1,875.2 | 2,707.7 | 3,208.7 | 3,802.4 | 4,506.0 |
| WACC, % | 11.24 | 11.25 | 11.26 | 11.08 | 11.13 | 11.19 | 11.19 | 11.19 | 11.19 | 11.19 |
| PV UFCF | ||||||||||
| SUM PV UFCF | 11,348.8 | |||||||||
| Long Term Growth Rate, % | 3.00 | |||||||||
| Free cash flow (T + 1) | 4,641 | |||||||||
| Terminal Value | 56,650 | |||||||||
| Present Terminal Value | 33,329 | |||||||||
| Enterprise Value | 44,678 | |||||||||
| Net Debt | 2,232 | |||||||||
| Equity Value | 42,446 | |||||||||
| Diluted Shares Outstanding, MM | 79 | |||||||||
| Equity Value Per Share | 538.11 |
What You Will Get
- Real MTZ Financials: Access to historical and projected data for precise valuation.
- Customizable Inputs: Adjust WACC, tax rates, revenue growth, and capital expenditures as needed.
- Dynamic Calculations: Intrinsic value and NPV are computed in real-time.
- Scenario Analysis: Evaluate various scenarios to assess MasTec’s future performance.
- User-Friendly Design: Designed for professionals while remaining approachable for newcomers.
Key Features
- Comprehensive MTZ Data: Pre-loaded with MasTec’s historical performance metrics and future projections.
- Customizable Financial Inputs: Tailor revenue growth, profit margins, WACC, tax rates, and capital expenditures to your preferences.
- Interactive Valuation Model: Automatically recalculates Net Present Value (NPV) and intrinsic value in response to your adjustments.
- Scenario Analysis: Develop various forecasting scenarios to explore different valuation possibilities.
- Intuitive Interface: Designed for ease of use, catering to both industry professionals and newcomers.
How It Works
- Step 1: Download the Excel file.
- Step 2: Review MasTec, Inc.'s (MTZ) pre-filled financial data and forecasts.
- Step 3: Modify critical inputs like revenue growth, WACC, and tax rates (highlighted cells).
- Step 4: Watch the DCF model update instantly as you tweak assumptions.
- Step 5: Analyze the outputs and use the results for investment decisions.
Why Choose MasTec, Inc. (MTZ)?
- Time Efficient: Skip the complexities of project planning – our solutions are ready to implement.
- Enhanced Precision: Accurate data and methodologies minimize discrepancies in project execution.
- Completely Adaptable: Modify our services to align with your specific needs and objectives.
- User-Friendly: Intuitive interfaces and detailed reports simplify the evaluation process.
- Preferred by Professionals: Developed for industry leaders who prioritize effectiveness and reliability.
Who Should Use This Product?
- Construction Management Students: Understand project financing and apply real-world scenarios to your studies.
- Researchers: Utilize industry-specific models for academic projects and publications.
- Investors: Evaluate your investment strategies and assess the financial health of MasTec, Inc. (MTZ).
- Industry Analysts: Enhance your analysis with a customizable financial model tailored for MasTec, Inc. (MTZ).
- Entrepreneurs: Learn how large infrastructure companies like MasTec, Inc. (MTZ) are evaluated in the market.
What the Template Contains
- Historical Data: Includes MasTec, Inc. (MTZ)’s past financials and baseline forecasts.
- DCF and Levered DCF Models: Detailed templates to calculate MasTec, Inc. (MTZ)’s intrinsic value.
- WACC Sheet: Pre-built calculations for Weighted Average Cost of Capital.
- Editable Inputs: Modify key drivers like growth rates, EBITDA %, and CAPEX assumptions.
- Quarterly and Annual Statements: A complete breakdown of MasTec, Inc. (MTZ)’s financials.
- Interactive Dashboard: Visualize valuation results and projections dynamically.
Disclaimer
All information, articles, and product details provided on this website are for general informational and educational purposes only. We do not claim any ownership over, nor do we intend to infringe upon, any trademarks, copyrights, logos, brand names, or other intellectual property mentioned or depicted on this site. Such intellectual property remains the property of its respective owners, and any references here are made solely for identification or informational purposes, without implying any affiliation, endorsement, or partnership.
We make no representations or warranties, express or implied, regarding the accuracy, completeness, or suitability of any content or products presented. Nothing on this website should be construed as legal, tax, investment, financial, medical, or other professional advice. In addition, no part of this site—including articles or product references—constitutes a solicitation, recommendation, endorsement, advertisement, or offer to buy or sell any securities, franchises, or other financial instruments, particularly in jurisdictions where such activity would be unlawful.
All content is of a general nature and may not address the specific circumstances of any individual or entity. It is not a substitute for professional advice or services. Any actions you take based on the information provided here are strictly at your own risk. You accept full responsibility for any decisions or outcomes arising from your use of this website and agree to release us from any liability in connection with your use of, or reliance upon, the content or products found herein.