
|
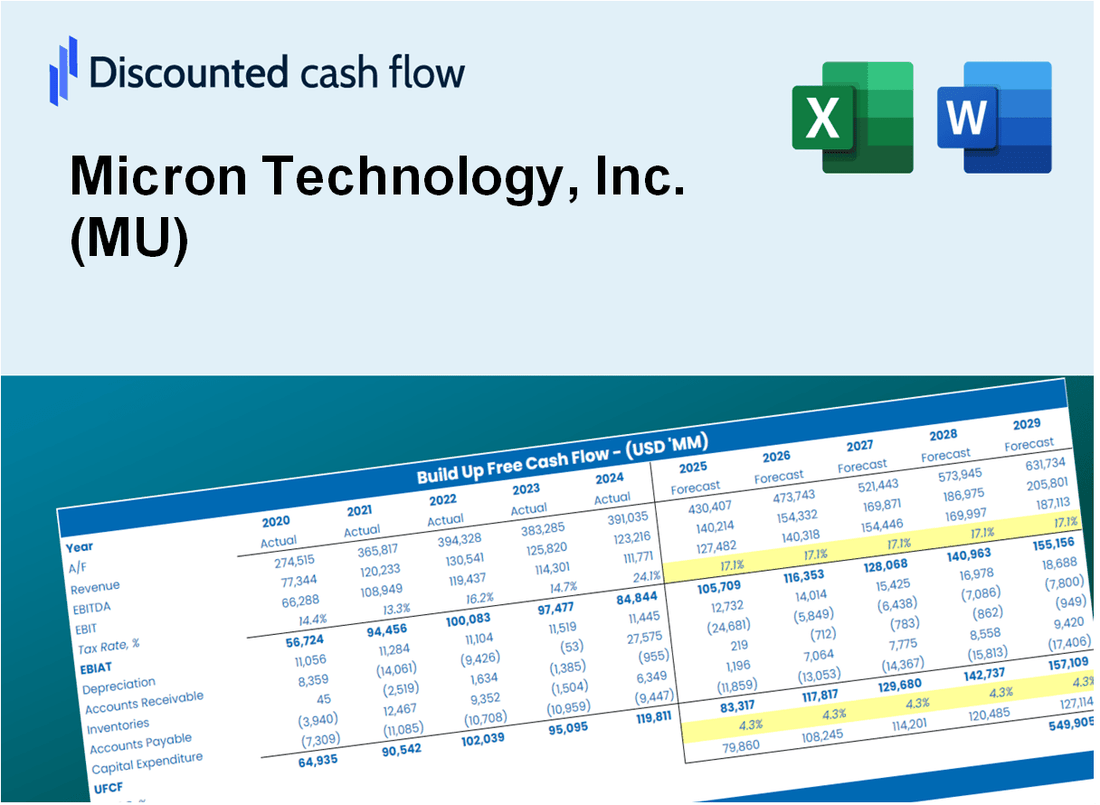
Valoración DCF de Micron Technology, Inc. (MU) |
Completamente Editable: Adáptelo A Sus Necesidades En Excel O Sheets
Diseño Profesional: Plantillas Confiables Y Estándares De La Industria
Predeterminadas Para Un Uso Rápido Y Eficiente
Compatible con MAC / PC, completamente desbloqueado
No Se Necesita Experiencia; Fáciles De Seguir
Micron Technology, Inc. (MU) Bundle
¡Simplifique la valoración de Micron Technology, Inc. (MU) con esta calculadora DCF personalizable! Con Real Micron Technology, Inc. (MU) financieras y entradas de pronóstico ajustables, puede probar escenarios y descubrir el valor razonable de Micron Technology, Inc. (MU) en minutos.
Discounted Cash Flow (DCF) - (USD MM)
| Year | AY1 2021 |
AY2 2022 |
AY3 2023 |
AY4 2024 |
AY5 2025 |
FY1 2026 |
FY2 2027 |
FY3 2028 |
FY4 2029 |
FY5 2030 |
|---|---|---|---|---|---|---|---|---|---|---|
| Revenue | 27,705.0 | 30,758.0 | 15,540.0 | 25,111.0 | 37,378.0 | 44,104.5 | 52,041.5 | 61,406.9 | 72,457.6 | 85,497.0 |
| Revenue Growth, % | 0 | 11.02 | -49.48 | 61.59 | 48.85 | 18 | 18 | 18 | 18 | 18 |
| EBITDA | 12,928.0 | 16,740.0 | 2,211.0 | 8,944.0 | 18,483.0 | 17,675.5 | 20,856.4 | 24,609.7 | 29,038.5 | 34,264.2 |
| EBITDA, % | 46.66 | 54.42 | 14.23 | 35.62 | 49.45 | 40.08 | 40.08 | 40.08 | 40.08 | 40.08 |
| Depreciation | 6,132.0 | 7,031.0 | 7,670.0 | 7,698.0 | 8,352.0 | 12,997.5 | 15,336.6 | 18,096.5 | 21,353.2 | 25,195.9 |
| Depreciation, % | 22.13 | 22.86 | 49.36 | 30.66 | 22.34 | 29.47 | 29.47 | 29.47 | 29.47 | 29.47 |
| EBIT | 6,796.0 | 9,709.0 | -5,459.0 | 1,246.0 | 10,131.0 | 4,678.0 | 5,519.8 | 6,513.2 | 7,685.3 | 9,068.3 |
| EBIT, % | 24.53 | 31.57 | -35.13 | 4.96 | 27.1 | 10.61 | 10.61 | 10.61 | 10.61 | 10.61 |
| Total Cash | 8,633.0 | 9,331.0 | 9,594.0 | 8,106.0 | 10,307.0 | 16,150.2 | 19,056.6 | 22,486.0 | 26,532.6 | 31,307.4 |
| Total Cash, percent | .0 | .0 | .0 | .0 | .0 | .0 | .0 | .0 | .0 | .0 |
| Account Receivables | 5,311.0 | 5,130.0 | 2,443.0 | 6,615.0 | 9,265.0 | 9,059.0 | 10,689.3 | 12,612.9 | 14,882.7 | 17,561.0 |
| Account Receivables, % | 19.17 | 16.68 | 15.72 | 26.34 | 24.79 | 20.54 | 20.54 | 20.54 | 20.54 | 20.54 |
| Inventories | 4,487.0 | 6,663.0 | 8,387.0 | 8,875.0 | 8,355.0 | 13,189.4 | 15,563.0 | 18,363.7 | 21,668.4 | 25,567.8 |
| Inventories, % | 16.2 | 21.66 | 53.97 | 35.34 | 22.35 | 29.9 | 29.9 | 29.9 | 29.9 | 29.9 |
| Accounts Payable | 1,744.0 | 2,142.0 | 1,725.0 | 2,726.0 | 3,132.0 | 3,845.4 | 4,537.4 | 5,354.0 | 6,317.5 | 7,454.4 |
| Accounts Payable, % | 6.29 | 6.96 | 11.1 | 10.86 | 8.38 | 8.72 | 8.72 | 8.72 | 8.72 | 8.72 |
| Capital Expenditure | -10,030.0 | -12,067.0 | -7,676.0 | -8,386.0 | -15,857.0 | -17,699.1 | -20,884.2 | -24,642.5 | -29,077.1 | -34,309.8 |
| Capital Expenditure, % | -36.2 | -39.23 | -49.4 | -33.4 | -42.42 | -40.13 | -40.13 | -40.13 | -40.13 | -40.13 |
| Tax Rate, % | 11.63 | 11.63 | 11.63 | 11.63 | 11.63 | 11.63 | 11.63 | 11.63 | 11.63 | 11.63 |
| EBITAT | 6,367.9 | 8,808.6 | -5,629.8 | 788.8 | 8,952.6 | 4,080.1 | 4,814.4 | 5,680.8 | 6,703.1 | 7,909.4 |
| Depreciation | ||||||||||
| Changes in Account Receivables | ||||||||||
| Changes in Inventories | ||||||||||
| Changes in Accounts Payable | ||||||||||
| Capital Expenditure | ||||||||||
| UFCF | -5,584.1 | 2,175.6 | -5,089.8 | -3,558.2 | -276.4 | -4,536.4 | -4,045.0 | -4,772.9 | -5,631.9 | -6,645.4 |
| WACC, % | 10.67 | 10.66 | 10.68 | 10.61 | 10.66 | 10.66 | 10.66 | 10.66 | 10.66 | 10.66 |
| PV UFCF | ||||||||||
| SUM PV UFCF | -18,687.2 | |||||||||
| Long Term Growth Rate, % | 2.00 | |||||||||
| Free cash flow (T + 1) | -6,778 | |||||||||
| Terminal Value | -78,308 | |||||||||
| Present Terminal Value | -47,199 | |||||||||
| Enterprise Value | -65,886 | |||||||||
| Net Debt | 5,636 | |||||||||
| Equity Value | -71,522 | |||||||||
| Diluted Shares Outstanding, MM | 1,125 | |||||||||
| Equity Value Per Share | -63.58 |
What You Will Get
- Real MU Financials: Access to historical and projected data for precise valuation.
- Customizable Inputs: Adjust WACC, tax rates, revenue growth, and capital expenditures as needed.
- Dynamic Calculations: Intrinsic value and NPV are computed in real-time.
- Scenario Analysis: Evaluate various scenarios to assess Micron's future performance.
- User-Friendly Design: Designed for industry professionals while remaining easy for newcomers.
Key Features
- Real-Life MU Data: Pre-filled with Micron’s historical financials and forward-looking projections.
- Fully Customizable Inputs: Adjust revenue growth, margins, WACC, tax rates, and capital expenditures.
- Dynamic Valuation Model: Automatic updates to Net Present Value (NPV) and intrinsic value based on your inputs.
- Scenario Testing: Create multiple forecast scenarios to analyze different valuation outcomes.
- User-Friendly Design: Simple, structured, and designed for professionals and beginners alike.
How It Works
- Download the Template: Gain immediate access to the Excel-based MU DCF Calculator.
- Input Your Assumptions: Modify the yellow-highlighted cells for growth rates, WACC, margins, and other variables.
- Instant Calculations: The model automatically recalculates Micron’s intrinsic value.
- Test Scenarios: Experiment with different assumptions to assess potential valuation shifts.
- Analyze and Decide: Leverage the results to inform your investment or financial analysis.
Why Choose Micron Technology, Inc. (MU)?
- Innovative Solutions: Cutting-edge memory and storage technologies that drive efficiency.
- High Performance: Products designed to meet the demands of modern computing and data centers.
- Commitment to Sustainability: Focused on environmentally friendly practices and reducing carbon footprint.
- Global Expertise: A trusted partner for industries worldwide, backed by years of experience.
- Strong Market Position: A leader in the semiconductor industry with a proven track record of growth.
Who Should Use This Product?
- Investors: Accurately estimate Micron Technology’s fair value before making investment decisions.
- CFOs: Leverage a professional-grade DCF model for financial reporting and analysis.
- Consultants: Quickly adapt the template for valuation reports for clients.
- Entrepreneurs: Gain insights into financial modeling used by leading semiconductor companies.
- Educators: Use it as a teaching tool to demonstrate valuation methodologies.
What the Template Contains
- Pre-Filled DCF Model: Micron Technology’s financial data preloaded for immediate use.
- WACC Calculator: Detailed calculations for Weighted Average Cost of Capital.
- Financial Ratios: Evaluate Micron’s profitability, leverage, and efficiency.
- Editable Inputs: Change assumptions such as growth, margins, and CAPEX to fit your scenarios.
- Financial Statements: Annual and quarterly reports to support detailed analysis.
- Interactive Dashboard: Easily visualize key valuation metrics and results.
Disclaimer
All information, articles, and product details provided on this website are for general informational and educational purposes only. We do not claim any ownership over, nor do we intend to infringe upon, any trademarks, copyrights, logos, brand names, or other intellectual property mentioned or depicted on this site. Such intellectual property remains the property of its respective owners, and any references here are made solely for identification or informational purposes, without implying any affiliation, endorsement, or partnership.
We make no representations or warranties, express or implied, regarding the accuracy, completeness, or suitability of any content or products presented. Nothing on this website should be construed as legal, tax, investment, financial, medical, or other professional advice. In addition, no part of this site—including articles or product references—constitutes a solicitation, recommendation, endorsement, advertisement, or offer to buy or sell any securities, franchises, or other financial instruments, particularly in jurisdictions where such activity would be unlawful.
All content is of a general nature and may not address the specific circumstances of any individual or entity. It is not a substitute for professional advice or services. Any actions you take based on the information provided here are strictly at your own risk. You accept full responsibility for any decisions or outcomes arising from your use of this website and agree to release us from any liability in connection with your use of, or reliance upon, the content or products found herein.