
|
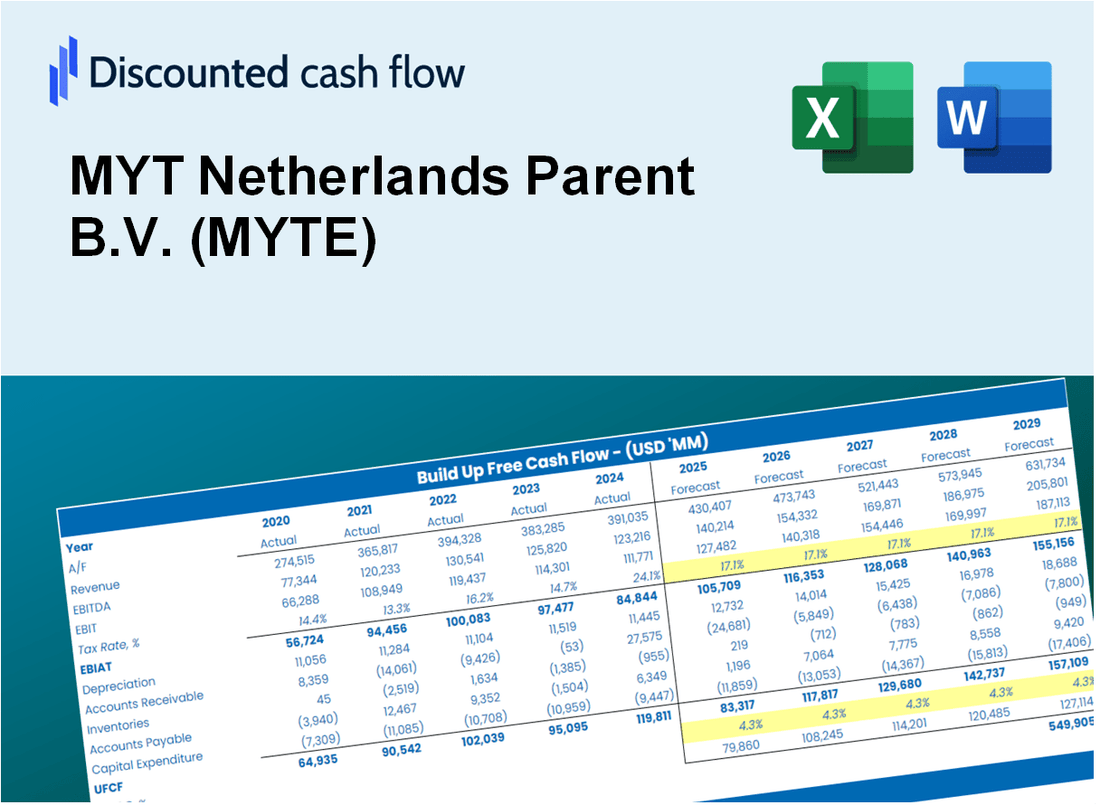
Valoración DCF de MYT Netherlands Parent B.V. (MYTE) |
Completamente Editable: Adáptelo A Sus Necesidades En Excel O Sheets
Diseño Profesional: Plantillas Confiables Y Estándares De La Industria
Predeterminadas Para Un Uso Rápido Y Eficiente
Compatible con MAC / PC, completamente desbloqueado
No Se Necesita Experiencia; Fáciles De Seguir
MYT Netherlands Parent B.V. (MYTE) Bundle
Diseñada para la precisión, nuestra calculadora DCF (MYTE) le permite evaluar la valoración de Myt Países Bajos B.V. utilizando datos financieros actualizados al tiempo que proporciona flexibilidad completa para modificar todos los parámetros esenciales para las proyecciones mejoradas.
What You Will Get
- Editable Forecast Inputs: Easily modify key assumptions (growth %, margins, WACC) to explore various scenarios.
- Real-World Data: MYT Netherlands Parent B.V. (MYTE) financial data pre-loaded to facilitate your analysis.
- Automatic DCF Outputs: The template computes Net Present Value (NPV) and intrinsic value automatically.
- Customizable and Professional: A sleek Excel model tailored to meet your valuation requirements.
- Built for Analysts and Investors: Perfect for assessing projections, validating strategies, and enhancing efficiency.
Key Features
- Comprehensive Financial Data: MYT Netherlands Parent B.V. (MYTE) offers detailed historical financial statements and projected forecasts.
- Customizable Parameters: Adjust inputs such as WACC, tax rates, revenue growth, and EBITDA margins to fit your analysis.
- Real-Time Valuation: Instantly view the recalculated intrinsic value of MYT Netherlands Parent B.V. (MYTE) as changes are made.
- Intuitive Visualizations: Utilize dashboard charts to visualize valuation outputs and essential metrics.
- Designed for Precision: A robust tool tailored for analysts, investors, and finance professionals.
How It Works
- Step 1: Download the Excel file for MYT Netherlands Parent B.V. (MYTE).
- Step 2: Review MYT's pre-filled financial data and forecasts.
- Step 3: Modify key inputs such as revenue growth, WACC, and tax rates (highlighted cells).
- Step 4: Observe the DCF model update in real-time as you adjust assumptions.
- Step 5: Analyze the outputs and leverage the results for your investment strategies.
Why Choose This Calculator for MYT Netherlands Parent B.V. (MYTE)?
- Designed for Experts: A sophisticated tool tailored for analysts, CFOs, and financial consultants.
- Accurate Financial Data: MYT’s historical and projected financials are preloaded for precision.
- Flexible Scenario Analysis: Effortlessly test various forecasts and assumptions.
- Comprehensive Outputs: Automatically computes intrinsic value, NPV, and essential metrics.
- User-Friendly: Step-by-step guidance makes the process straightforward.
Who Should Use MYT Netherlands Parent B.V. (MYTE)?
- Finance Students: Explore financial modeling techniques and apply them with real-world data.
- Academics: Integrate advanced valuation models into your teaching or research projects.
- Investors: Validate your investment hypotheses and evaluate valuation metrics for MYT Netherlands Parent B.V. (MYTE).
- Analysts: Enhance your analysis with a ready-to-use, customizable DCF model tailored for MYTE.
- Small Business Owners: Understand how major public companies like MYT Netherlands Parent B.V. (MYTE) are valued in the market.
What the Template Contains
- Pre-Filled DCF Model: MYT Netherlands Parent B.V.’s (MYTE) financial data preloaded for immediate use.
- WACC Calculator: Detailed calculations for Weighted Average Cost of Capital.
- Financial Ratios: Evaluate MYT Netherlands Parent B.V.’s (MYTE) profitability, leverage, and efficiency.
- Editable Inputs: Change assumptions such as growth, margins, and CAPEX to fit your scenarios.
- Financial Statements: Annual and quarterly reports to support detailed analysis.
- Interactive Dashboard: Easily visualize key valuation metrics and results.
Disclaimer
All information, articles, and product details provided on this website are for general informational and educational purposes only. We do not claim any ownership over, nor do we intend to infringe upon, any trademarks, copyrights, logos, brand names, or other intellectual property mentioned or depicted on this site. Such intellectual property remains the property of its respective owners, and any references here are made solely for identification or informational purposes, without implying any affiliation, endorsement, or partnership.
We make no representations or warranties, express or implied, regarding the accuracy, completeness, or suitability of any content or products presented. Nothing on this website should be construed as legal, tax, investment, financial, medical, or other professional advice. In addition, no part of this site—including articles or product references—constitutes a solicitation, recommendation, endorsement, advertisement, or offer to buy or sell any securities, franchises, or other financial instruments, particularly in jurisdictions where such activity would be unlawful.
All content is of a general nature and may not address the specific circumstances of any individual or entity. It is not a substitute for professional advice or services. Any actions you take based on the information provided here are strictly at your own risk. You accept full responsibility for any decisions or outcomes arising from your use of this website and agree to release us from any liability in connection with your use of, or reliance upon, the content or products found herein.