
|
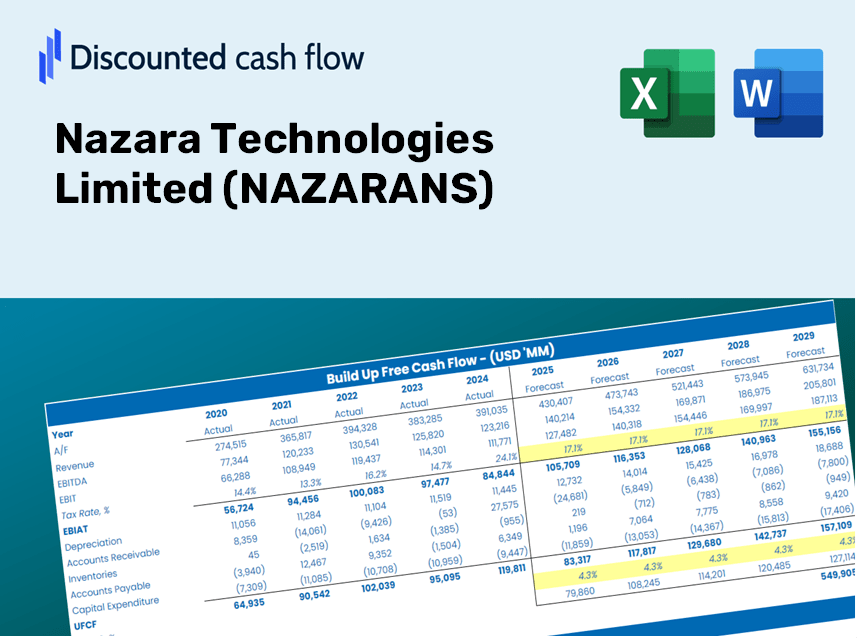
Valoración de DCF de Nazara Technologies Limited (Nazara.NS) |
Completamente Editable: Adáptelo A Sus Necesidades En Excel O Sheets
Diseño Profesional: Plantillas Confiables Y Estándares De La Industria
Predeterminadas Para Un Uso Rápido Y Eficiente
Compatible con MAC / PC, completamente desbloqueado
No Se Necesita Experiencia; Fáciles De Seguir
Nazara Technologies Limited (NAZARA.NS) Bundle
¡Descubra el verdadero potencial de Nazara Technologies Limited con nuestra calculadora DCF de grado profesional! Ajuste los supuestos clave, explore varios escenarios y examine cómo los cambios afectan la valoración de Nazara Technologies Limited, todo dentro de una sola plantilla de Excel.
What You Will Receive
- Accurate NAZARANS Financial Data: Pre-loaded with Nazara Technologies' historical and projected performance metrics for in-depth analysis.
- Customizable Template: Easily adjust key inputs such as revenue growth, WACC, and EBITDA percentages.
- Instant Calculations: Watch as Nazara's intrinsic value updates in real-time based on your modifications.
- Comprehensive Valuation Tool: Crafted for investors, analysts, and consultants aiming for precise DCF results.
- Intuitive Design: A straightforward layout and clear guidelines suitable for users of all experience levels.
Key Features
- Pre-Loaded Data: Historical financial statements and pre-filled forecasts for Nazara Technologies Limited (NAZARANS).
- Fully Adjustable Inputs: Customize WACC, tax rates, revenue growth, and EBITDA margins.
- Instant Results: Watch Nazara Technologies Limited’s (NAZARANS) intrinsic value update in real time.
- Clear Visual Outputs: Dashboard charts present valuation results and essential metrics.
- Built for Accuracy: A professional-grade tool for analysts, investors, and finance professionals.
How It Works
- Step 1: Download the provided Excel template populated with data for Nazara Technologies Limited (NAZARANS).
- Step 2: Review the filled sheets and familiarize yourself with the essential metrics.
- Step 3: Modify forecasts and assumptions in the editable yellow cells (WACC, growth, margins).
- Step 4: Immediately view updated results, including the intrinsic value of Nazara Technologies Limited (NAZARANS).
- Step 5: Utilize the outputs to make informed investment choices or create comprehensive reports.
Why Opt for Nazara Technologies Limited (NAZARANS)?
- Precision: Utilizes accurate financial data for reliable results.
- Versatility: Crafted to allow users to experiment and adjust inputs effortlessly.
- Efficiency: Eliminate the need to create a financial model from the ground up.
- High-Quality: Engineered with the expertise and standards expected at the CFO level.
- Intuitive: Simple interface that caters to users with varying degrees of financial modeling experience.
Who Should Benefit from Nazara Technologies Limited (NAZARANS)?
- Individual Investors: Make educated choices regarding the purchase or sale of Nazara Technologies shares.
- Financial Analysts: Enhance valuation methods with accessible financial models tailored for Nazara Technologies.
- Consultants: Provide clients with timely and precise valuation insights associated with Nazara Technologies.
- Business Owners: Gain a deeper understanding of how major companies like Nazara Technologies are valued to inform your own business strategies.
- Finance Students: Acquire practical valuation skills utilizing real-world data and case studies related to Nazara Technologies.
Contents of the Template
- Historical Data: Contains Nazara Technologies Limited's (NAZARANS) previous financial performance and baseline projections.
- DCF and Levered DCF Models: Comprehensive templates for calculating the intrinsic value of Nazara Technologies Limited (NAZARANS).
- WACC Sheet: Pre-configured calculations for the Weighted Average Cost of Capital.
- Editable Inputs: Customize essential parameters such as growth rates, EBITDA percentages, and CAPEX assumptions.
- Quarterly and Annual Statements: An extensive analysis of Nazara Technologies Limited's (NAZARANS) financial reports.
- Interactive Dashboard: Dynamically visualize valuation outcomes and forecasts.
Disclaimer
All information, articles, and product details provided on this website are for general informational and educational purposes only. We do not claim any ownership over, nor do we intend to infringe upon, any trademarks, copyrights, logos, brand names, or other intellectual property mentioned or depicted on this site. Such intellectual property remains the property of its respective owners, and any references here are made solely for identification or informational purposes, without implying any affiliation, endorsement, or partnership.
We make no representations or warranties, express or implied, regarding the accuracy, completeness, or suitability of any content or products presented. Nothing on this website should be construed as legal, tax, investment, financial, medical, or other professional advice. In addition, no part of this site—including articles or product references—constitutes a solicitation, recommendation, endorsement, advertisement, or offer to buy or sell any securities, franchises, or other financial instruments, particularly in jurisdictions where such activity would be unlawful.
All content is of a general nature and may not address the specific circumstances of any individual or entity. It is not a substitute for professional advice or services. Any actions you take based on the information provided here are strictly at your own risk. You accept full responsibility for any decisions or outcomes arising from your use of this website and agree to release us from any liability in connection with your use of, or reliance upon, the content or products found herein.