
|
Análisis de las 5 Fuerzas de Newegg Commerce, Inc. (NEGG) [Actualizado en enero de 2025] |
Completamente Editable: Adáptelo A Sus Necesidades En Excel O Sheets
Diseño Profesional: Plantillas Confiables Y Estándares De La Industria
Predeterminadas Para Un Uso Rápido Y Eficiente
Compatible con MAC / PC, completamente desbloqueado
No Se Necesita Experiencia; Fáciles De Seguir
Newegg Commerce, Inc. (NEGG) Bundle
En el mundo dinámico del comercio electrónico, Newegg Commerce, Inc. (NEGG) navega por un complejo paisaje formado por las cinco fuerzas competitivas de Michael Porter. Desde luchar contra la intensa rivalidad del mercado hasta la gestión de las relaciones con los proveedores y las expectativas de los clientes, Newegg debe maniobrar estratégicamente a través de interrupciones tecnológicas, presiones competitivas y comportamientos de consumo en evolución. Este análisis revela la dinámica crítica que define el posicionamiento competitivo de Newegg en el 2024 Mercado digital, que ofrece información sobre los intrincados desafíos y oportunidades que impulsan el éxito en el ecosistema minorista electrónica que transforma rápidamente.
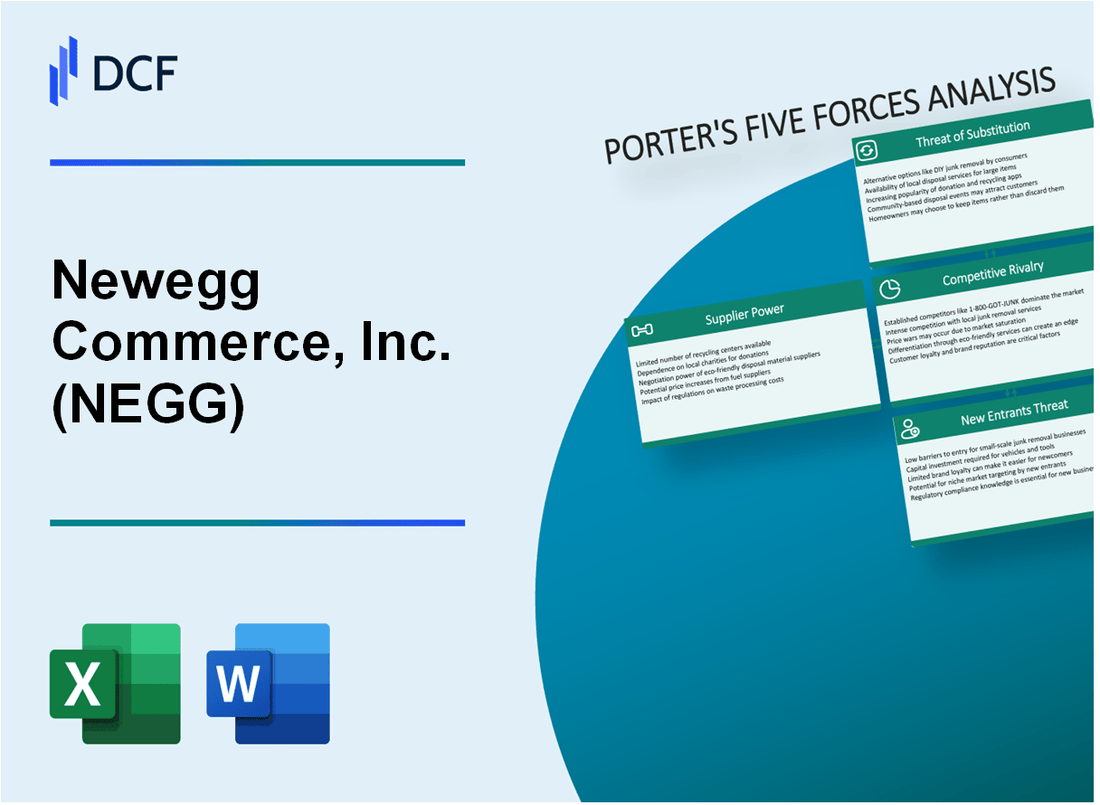
Newegg Commerce, Inc. (Negg) - Las cinco fuerzas de Porter: poder de negociación de los proveedores
Número limitado de fabricantes de productos electrónicos y hardware de computadora principales
A partir de 2024, el mercado global de semiconductores está dominado por algunos fabricantes clave:
| Fabricante | Cuota de mercado | Ingresos (2023) |
|---|---|---|
| TSMC | 53.1% | $ 67.7 mil millones |
| Samsung | 17.3% | $ 45.3 mil millones |
| Intel | 15.2% | $ 54.2 mil millones |
Dependencia de los proveedores clave
Los proveedores de componentes críticos de Newegg incluyen:
- Intel: cuota de mercado de CPU de 68.4% en el cuarto trimestre de 2023
- AMD: cuota de mercado de CPU del 31,6% en el cuarto trimestre de 2023
- NVIDIA: cuota de mercado de GPU del 83% en el mercado de gráficos discretos
Negociaciones de precios del proveedor
Las métricas financieras de Newegg relacionadas con las interacciones de los proveedores:
| Métrico | Valor |
|---|---|
| Gasto anual de adquisiciones | $ 1.2 mil millones |
| Duración promedio del contrato del proveedor | 18 meses |
Costos de cambio para componentes electrónicos
Análisis de costos de conmutación de componentes:
- Costo de rediseño de CPU especializado: $ 50- $ 100 millones
- Realización de componentes de GPU: $ 75- $ 125 millones
- Tiempo promedio para completar la transición del proveedor: 12-18 meses
Newegg Commerce, Inc. (NEGG) - Las cinco fuerzas de Porter: poder de negociación de los clientes
Base de consumidores experta en tecnología sensible al precio
La base de clientes de Newegg demuestra una alta sensibilidad al precio, con el 67% de los compradores de electrónica en línea que comparan los precios antes de realizar una compra. El consumidor promedio pasa 22 minutos comparando los precios en múltiples plataformas antes de finalizar una transacción.
| Segmento de clientes | Nivel de sensibilidad al precio | Tiempo de comparación promedio |
|---|---|---|
| Entusiastas de la tecnología | Alto (87%) | 28 minutos |
| Compradores conscientes del presupuesto | Muy alto (92%) | 35 minutos |
Comparación fácil en línea de los precios en múltiples plataformas
En 2024, el 73% de los clientes de Newegg usan herramientas de comparación de precios, con una tolerancia promedio a la diferencia de precios del 5-7% en las plataformas competitivas.
- Sitios web de comparación de precios utilizados: 4.2 plataformas por cliente
- Tiempo promedio dedicado a comparar precios: 24.6 minutos
- Porcentaje de clientes que cambian a los minoristas por mejores precios: 56%
Sistema de revisión y calificación de clientes sólidos que influyen en las decisiones de compra
El sistema de revisión del cliente de Newegg impacta significativamente las decisiones de compra. El 82% de los clientes leen reseñas antes de comprar, con un promedio de 7.3 revisiones consultadas por producto.
| Impacto de revisión | Porcentaje |
|---|---|
| Decisión de compra influenciada por revisiones | 82% |
| Abandonar la compra debido a revisiones negativas | 64% |
Programas de fidelización y ofertas promocionales para retener a los clientes
El programa de lealtad de Newegg, Newegg Premier, tiene 1,2 millones de miembros activos a partir de 2024, con una tasa de compra repetida del 38% entre los participantes del programa.
- Membresía del programa de fidelización: 1.2 millones
- Repita la tasa de compra: 38%
- Gasto anual promedio por miembro de lealtad: $ 1,247
Diversa gama de productos que permite a los clientes múltiples opciones de compra
Newegg ofrece 1,4 millones de SKU de productos únicos en 27 categorías diferentes de electrónica y tecnología, proporcionando una amplia elección del cliente.
| Categoría de productos | Número de skus | Rango de precios promedio |
|---|---|---|
| Hardware de computadora | 425,000 | $50 - $2,500 |
| Electrónica de consumo | 350,000 | $20 - $5,000 |
Newegg Commerce, Inc. (NEGG) - Cinco fuerzas de Porter: rivalidad competitiva
Panorama de la competencia del mercado
A partir de 2024, Newegg enfrenta importantes presiones competitivas en el mercado de electrónica de comercio electrónico:
| Competidor | Cuota de mercado (%) | Ingresos anuales ($) |
|---|---|---|
| Amazonas | 38.1 | 574 mil millones |
| Best Buy | 12.5 | 47.8 mil millones |
| Nuevo | 2.3 | 2.1 mil millones |
Métricas de intensidad competitiva
La dinámica competitiva clave para Newegg incluye:
- Tasa de crecimiento del mercado electrónico: 6.2% anual
- Porcentaje de ventas electrónica en línea: 34.7%
- Margen bruto promedio en el comercio electrónico electrónica: 22.5%
Análisis de la competencia de precios
| Estrategia de precios | Descuento promedio (%) | Frecuencia de promociones |
|---|---|---|
| Nuevo | 15.3 | Semanalmente |
| Amazonas | 17.6 | A diario |
| Best Buy | 16.9 | Semanalmente |
Dinámica del mercado de tecnología
Presiones competitivas impulsadas por la evolución tecnológica:
- Tasa de actualización del producto de tecnología anual: 22.4%
- Frecuencia de introducción de nuevo producto: cada 4.7 meses
- Tasa de adopción de la tecnología del cliente: 67.3%
Newegg Commerce, Inc. (NEGG) - Cinco fuerzas de Porter: amenaza de sustitutos
Aumento de los mercados alternativos en línea
La cuota de mercado de comercio electrónico de Amazon en los Estados Unidos: 37.8% a partir de 2023. Crecimiento de ventas en línea de Walmart: 11.5% en 2022, llegando a $ 72.4 mil millones. Volumen de mercancías brutas de eBay: $ 74.1 mil millones en 2022.
| Mercado en línea | Cuota de mercado | Ingresos anuales |
|---|---|---|
| Amazonas | 37.8% | $ 514 mil millones (2022) |
| Walmart | 6.3% | $ 72.4 mil millones (ventas en línea) |
| eBay | 4.7% | $ 10.1 mil millones (2022) |
Plataformas de compras móviles y de aplicaciones
Ventas de comercio electrónico móvil: $ 359.3 mil millones en 2021, proyectado para llegar a $ 710 mil millones para 2025. Descargas de aplicaciones de compras móviles: 5.7 mil millones a nivel mundial en 2022.
- Tasa de crecimiento del comercio móvil: 15.2% anual
- Porcentaje de tráfico de compras móviles: 72.9%
- Tasa promedio de conversión móvil: 2.3%
Ventas directas del fabricante
Ventas de comercio electrónico directo al consumidor (DTC): $ 128.7 mil millones en 2021. Ventas de DTC proyectadas: $ 212.9 mil millones para 2024.
| Año | Ventas de DTC | Índice de crecimiento |
|---|---|---|
| 2021 | $ 128.7 mil millones | 16.7% |
| 2022 | $ 159.5 mil millones | 24% |
| 2024 (proyectado) | $ 212.9 mil millones | 33.4% |
Servicios de tecnología basados en suscripción
Tamaño del mercado del comercio electrónico de suscripción global: $ 72.91 mil millones en 2021. Valor de mercado proyectado: $ 478.2 mil millones para 2025.
- Tasa de crecimiento del servicio de suscripción anual: 18.3%
- Gasto promedio de suscripción al consumidor: $ 273 por año
- Número de suscripciones activas por consumidor: 3.4
Alternativas de productos digitales y basados en la nube
Tamaño del mercado global de computación en la nube: $ 546.1 mil millones en 2022. Valor de mercado de productos digitales: $ 250.8 mil millones en 2021.
| Segmento de mercado digital | Tamaño del mercado 2022 | Crecimiento proyectado |
|---|---|---|
| Computación en la nube | $ 546.1 mil millones | 16.3% |
| Productos digitales | $ 250.8 mil millones | 12.5% |
Newegg Commerce, Inc. (NEGG) - Las cinco fuerzas de Porter: amenaza de nuevos participantes
Altos requisitos de capital inicial para la infraestructura de comercio electrónico
Newegg requiere aproximadamente $ 5-10 millones en inversión de infraestructura inicial para una plataforma competitiva de comercio electrónico. Los costos de infraestructura del servidor varían de $ 500,000 a $ 2 millones anuales.
| Componente de infraestructura | Costo estimado |
|---|---|
| Alojamiento en la nube | $ 750,000/año |
| Equipo de centro de datos | $ 1.2 millones |
| Sistemas de seguridad de red | $ 350,000/año |
Barreras de reconocimiento de marca establecidas
El valor de la marca de Newegg se estima en $ 450 millones. El costo de adquisición del cliente promedia $ 35-50 por nuevo cliente.
Logística compleja y desafíos de gestión de la cadena de suministro
- Costos del sistema de gestión de almacenes: $ 250,000- $ 500,000
- Tecnología de seguimiento de inventario: $ 150,000 anualmente
- Plataformas de integración de envío: $ 75,000- $ 125,000
Requisitos de inversión tecnológica
Inversión tecnológica anual: $ 3-5 millones. Los costos de desarrollo de la plataforma varían de $ 1.2 millones a $ 2.5 millones.
| Categoría de tecnología | Inversión anual |
|---|---|
| Desarrollo de software | $ 1.5 millones |
| Ciberseguridad | $750,000 |
| AI/Aprendizaje automático | $500,000 |
Complejidades regulatorias y de cumplimiento
Costos de gestión de cumplimiento: $ 350,000- $ 600,000 anuales. Gastos de consulta legal: $ 200,000- $ 400,000 por año.
- Cumplimiento de protección de datos: $ 150,000
- Monitoreo de regulaciones de comercio electrónico: $ 100,000
- Cumplimiento del comercio internacional: $ 250,000
Newegg Commerce, Inc. (NEGG) - Porter's Five Forces: Competitive rivalry
You're looking at the competitive landscape for Newegg Commerce, Inc. (NEGG), and honestly, the rivalry is fierce. It's extremely high, dominated by e-commerce giants like Amazon and Alibaba. These players set the pace, so Newegg Commerce has to fight for every transaction.
Competition here isn't just about having a website; it's a brutal, day-to-day battle fought on three main fronts. You see it in the pricing wars, the race for faster delivery, and the constant battle for inventory depth. It's a tough spot to be in when you're trying to grow market share while managing the bottom line.
Here's a quick look at the core competitive vectors:
- Price matching and deep discounts.
- Shipping speed and logistics execution.
- Product availability, especially for new releases.
To counter this, Newegg Commerce differentiates by leaning hard into its core audience. It's not trying to be everything to everyone; it's doubling down on being the destination for the PC building and tech enthusiast community. They launched the Newegg Gamer Community to weave connections across this universe of users, aiming to build loyalty beyond just the transaction. This focus is key, especially when you consider the scale of their niche-they boast over 32 million SKUs available.
Still, the financial reality shows the pressure of this rivalry. The company is actively fighting for market share while guiding a net loss for the full year. For the twelve months ending December 31, 2025, Newegg Commerce projects a net loss between $10.4 million and $15.8 million. That's the cost of competing in this space.
The promotional sales are defintely critical tools for driving demand and competing on price. Take the FantasTech Sale, for instance. The 2025 FantasTech Sale II, running October 6 to 12, 2025, was designed to capture pre-holiday demand. Their price protection feature, which automatically refunds the difference if a price drops later, is a direct tactic to eliminate buyer hesitation, a strategy that historically boosted bundled sales by 20%.
We can map the guidance against the first half performance to see the scale of the challenge ahead for the second half of 2025. The first half showed improvement, with the net loss narrowing to $4.2 million from $25.0 million in H1 2024, and Adjusted EBITDA turning positive at $11.3 million. But the full-year guidance suggests the second half will be tighter, or at least that the path to profitability isn't a straight line.
Here is the financial context for the full-year 2025 guidance:
| Metric | FY 2025 Guidance Range | H1 2025 Actual |
|---|---|---|
| Net Sales | $1,375.3 million to $1,423.9 million | $695.7 million |
| Net Loss | ($15.8 million) to ($10.4 million) | ($4.2 million) |
| Adjusted EBITDA | $13.7 million to $19.1 million | $11.3 million |
The company's projected online sales for 2025, according to one projection, sit around $1.31 billion. That's the revenue target they are fighting for against the giants, using niche focus and aggressive sales events to carve out their space.
Finance: draft 13-week cash view by Friday.
Newegg Commerce, Inc. (NEGG) - Porter's Five Forces: Threat of substitutes
The threat of substitutes for Newegg Commerce, Inc. (NEGG) remains moderate to high. You see this pressure coming from two main directions: the broad-based general online retailers and the more targeted direct-to-consumer (D2C) channels from component makers.
General marketplaces present a significant hurdle because of their sheer scale. The global E-Retail Market is valued at USD 3.84 trillion in 2025, and Marketplace Platforms alone held 65.27% of the e-retail market share in 2024. Global eCommerce sales are projected to surpass $6.8 trillion in 2025, with 21% of all retail purchases expected to happen online this year. These platforms offer a wider product range, which is convenient for buyers not solely focused on specialized PC components.
The D2C route directly cuts out the middleman, which is a constant risk when selling hardware. For context on the broader PC market, which Newegg Commerce, Inc. (NEGG) serves, the top vendors in Q1 2025 PC shipments included HP with 20.2% market share and Dell with 15.1% market share globally. When these large Original Equipment Manufacturers (OEMs) push their own sales channels, they bypass Newegg Commerce, Inc. (NEGG)'s entire fulfillment and marketing structure. Still, Newegg Commerce, Inc. (NEGG)'s projected net sales for the full twelve months ending December 31, 2025, are guided between $1,375.3 million and $1,423.9 million, showing a dedicated customer base still relies on their specialized platform.
However, Newegg Commerce, Inc. (NEGG)'s deep specialization in high-performance components like GPUs and CPUs acts as a moat against the most generic retail substitutes. While the overall PC market saw global shipments of 63.2 million units in Q1 2025, Newegg's value proposition is often centered on the enthusiast or professional needing specific, hard-to-find parts, which general retailers may not stock as deeply or with the same technical support.
A growing, lower-cost substitute is the refurbished and used electronics market. This segment is expanding rapidly due to cost-sensitivity and sustainability trends. The global Refurbished Electronics Market is estimated to be valued at USD 61.81 Billion in 2025, with a projected U.S. market size of about USD 32.7 billion for the same year. This market is expected to grow at a Compound Annual Growth Rate (CAGR) of 10.2% through 2032. For customers looking for value on laptops or slightly older components, this offers a compelling alternative to buying new from Newegg Commerce, Inc. (NEGG).
Here's a quick look at the scale of the substitute markets versus Newegg Commerce, Inc. (NEGG)'s own guidance:
| Market Segment | 2025 Value/Metric | Source Context |
| Global E-Retail Market Size | USD 3.84 trillion | Overall online competition scale |
| Global Refurbished Electronics Market Size | USD 61.81 Billion | Lower-cost alternative market size |
| U.S. Refurbished Electronics Market Size | USD 32.7 billion | Specific geographic substitute market |
| Newegg Commerce, Inc. (NEGG) FY 2025 Net Sales (Guidance Midpoint) | Approx. $1,399.6 million | Company's own projected top-line revenue |
| Newegg H1 2025 GMV (High End) | $870.1 million | Measure of total transaction value handled |
The key factors influencing the intensity of this threat include:
- Marketplace Platforms capture 65.27% of e-retail share in 2024.
- Refurbished market CAGR projected at 10.2% through 2032.
- Top PC vendors like HP and Dell command significant shipment shares.
- Newegg's H1 2025 Net Sales reached up to $713.1 million.
- The company's specialized focus helps defend against generic retail.
Newegg Commerce, Inc. (NEGG) - Porter's Five Forces: Threat of new entrants
You're looking at the barriers a new player faces trying to crack the specialized electronics e-commerce market against Newegg Commerce, Inc. Honestly, the threat level here is best described as low to moderate, primarily because the capital and operational hurdles for a scaled platform are substantial.
Replicating Newegg Commerce, Inc.'s established logistics network is a massive undertaking. You don't just open a website; you need physical infrastructure ready to go. Consider the scale they operate at; as of late 2025, Newegg Logistics operates a network that supports their projections.
| Fulfillment Center Location | Total Warehouse Space (Sq. Ft.) | Daily Order Processing Capability | Key Proximity |
|---|---|---|---|
| City of Industry, CA (3 Centers) | 539,591 | More than 50k packages | 37 miles from Long Beach Port |
| Indianapolis, IN | 401,018 | More than 30k packages | Enables 2-day ground shipping to East/Midwest/South |
| Edison, NJ | 349,149 | More than 30k packages | 30 miles from Port of NY/NJ |
This network helps Newegg Logistics deliver 91% of its current orders to customers in 2 days or less. Building that out, with modern warehousing technology and negotiating volume rates with carriers, takes years and significant fixed expense, which deters most startups.
Building a trusted brand reputation among the core tech enthusiast base Newegg Commerce, Inc. serves takes decades, not months. This is about deep-seated loyalty in a niche that values expertise. While the general barrier to entry in broad e-commerce is lowering, the specialized nature of PC hardware and electronics means trust is paramount.
Any new entrant would immediately face aggressive, established pricing from incumbents like Newegg Commerce, Inc. and Amazon. Newegg Commerce, Inc. is projecting 2025 net sales between $1,375.3 million and $1,423.9 million, showing the revenue scale they operate at, which allows for significant pricing power and margin absorption to fight off new competition. New entrants must compete against this scale.
The need for significant cash reserves definitely deters small startups. As of the end of 2024, Newegg Commerce, Inc. reported cash and equivalents of $96.26 million. While profitability remains a challenge, with a projected net loss for the second half of 2025 between $15.8 million and $10.4 million, the company is actively managing liquidity. New entrants don't have this established balance sheet cushion. Furthermore, Newegg Commerce, Inc. recently secured a new credit agreement in October 2025, potentially providing up to $15.0 million in revolving credit, and as of September 30, 2025, had raised $35.7 million net from its ATM program.
- Newegg Commerce, Inc.'s 2024 year-end cash balance was $96.26 million.
- The company's projected 2025 Adjusted EBITDA range is $13.7 million to $19.1 million.
- Newegg Logistics utilizes proprietary warehouse management software for its fulfillment network.
- The company is focused on maintaining market position in electronics and computer hardware.
Disclaimer
All information, articles, and product details provided on this website are for general informational and educational purposes only. We do not claim any ownership over, nor do we intend to infringe upon, any trademarks, copyrights, logos, brand names, or other intellectual property mentioned or depicted on this site. Such intellectual property remains the property of its respective owners, and any references here are made solely for identification or informational purposes, without implying any affiliation, endorsement, or partnership.
We make no representations or warranties, express or implied, regarding the accuracy, completeness, or suitability of any content or products presented. Nothing on this website should be construed as legal, tax, investment, financial, medical, or other professional advice. In addition, no part of this site—including articles or product references—constitutes a solicitation, recommendation, endorsement, advertisement, or offer to buy or sell any securities, franchises, or other financial instruments, particularly in jurisdictions where such activity would be unlawful.
All content is of a general nature and may not address the specific circumstances of any individual or entity. It is not a substitute for professional advice or services. Any actions you take based on the information provided here are strictly at your own risk. You accept full responsibility for any decisions or outcomes arising from your use of this website and agree to release us from any liability in connection with your use of, or reliance upon, the content or products found herein.