
|
Valoración de DCF de Neoen S.A. (Neoen.PA) |
Completamente Editable: Adáptelo A Sus Necesidades En Excel O Sheets
Diseño Profesional: Plantillas Confiables Y Estándares De La Industria
Predeterminadas Para Un Uso Rápido Y Eficiente
Compatible con MAC / PC, completamente desbloqueado
No Se Necesita Experiencia; Fáciles De Seguir
Neoen S.A. (NEOEN.PA) Bundle
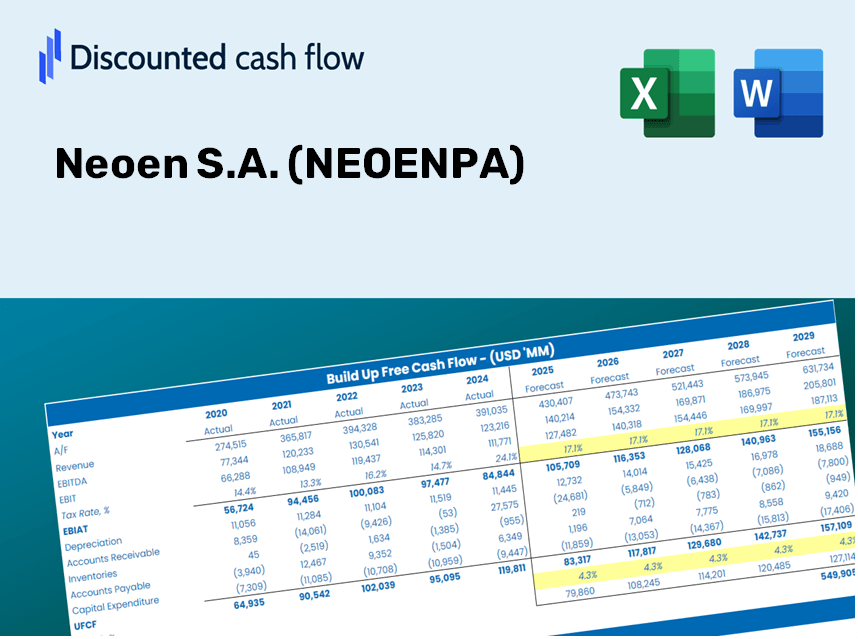
¡Simplifique la valoración de Neoen S.A. (Neoenpa) con esta calculadora DCF personalizable! Con el Real Neoen S.A. (Neoenpa) financieros y las entradas de pronóstico ajustables, puede probar escenarios y descubrir el valor razonable de Neoen S.A. (Neoenpa) en minutos.
Discounted Cash Flow (DCF) - (USD MM)
| Year | AY1 2019 |
AY2 2020 |
AY3 2021 |
AY4 2022 |
AY5 2023 |
FY1 2024 |
FY2 2025 |
FY3 2026 |
FY4 2027 |
FY5 2028 |
|---|---|---|---|---|---|---|---|---|---|---|
| Revenue | 253.2 | 298.8 | 333.6 | 503.2 | 524.4 | 635.5 | 770.0 | 933.1 | 1,130.7 | 1,370.1 |
| Revenue Growth, % | 0 | 18.01 | 11.65 | 50.84 | 4.21 | 21.18 | 21.18 | 21.18 | 21.18 | 21.18 |
| EBITDA | 215.6 | 215.6 | 297.0 | 396.1 | 572.3 | 540.2 | 654.6 | 793.2 | 961.2 | 1,164.8 |
| EBITDA, % | 85.15 | 72.16 | 89.03 | 78.72 | 109.13 | 85.01 | 85.01 | 85.01 | 85.01 | 85.01 |
| Depreciation | 80.2 | 109.8 | 107.6 | 151.0 | 176.0 | 208.7 | 252.9 | 306.5 | 371.4 | 450.1 |
| Depreciation, % | 31.67 | 36.75 | 32.25 | 30.01 | 33.56 | 32.85 | 32.85 | 32.85 | 32.85 | 32.85 |
| EBIT | 135.4 | 105.8 | 189.4 | 245.1 | 396.3 | 343.1 | 415.7 | 503.8 | 610.4 | 739.7 |
| EBIT, % | 53.48 | 35.41 | 56.77 | 48.71 | 75.57 | 53.99 | 53.99 | 53.99 | 53.99 | 53.99 |
| Total Cash | 460.5 | 374.9 | 592.6 | 622.8 | 773.7 | 635.5 | 770.0 | 933.1 | 1,130.7 | 1,370.1 |
| Total Cash, percent | .0 | .0 | .0 | .0 | .0 | .0 | .0 | .0 | .0 | .0 |
| Account Receivables | 150.3 | 170.0 | 186.7 | 199.3 | 115.2 | 297.1 | 360.1 | 436.3 | 528.7 | 640.7 |
| Account Receivables, % | 59.36 | 56.89 | 55.97 | 39.61 | 21.97 | 46.76 | 46.76 | 46.76 | 46.76 | 46.76 |
| Inventories | 6.2 | 12.4 | 10.7 | 42.9 | 9.8 | 25.7 | 31.1 | 37.7 | 45.7 | 55.4 |
| Inventories, % | 2.45 | 4.15 | 3.21 | 8.53 | 1.87 | 4.04 | 4.04 | 4.04 | 4.04 | 4.04 |
| Accounts Payable | 126.3 | 5.9 | 24.2 | 242.4 | 58.0 | 150.4 | 182.3 | 220.8 | 267.6 | 324.3 |
| Accounts Payable, % | 49.88 | 1.97 | 7.25 | 48.17 | 11.06 | 23.67 | 23.67 | 23.67 | 23.67 | 23.67 |
| Capital Expenditure | -737.5 | -529.7 | -754.5 | -1,111.2 | -1,046.0 | -635.5 | -770.0 | -933.1 | -1,130.7 | -1,370.1 |
| Capital Expenditure, % | -291.27 | -177.28 | -226.17 | -220.83 | -199.47 | -100 | -100 | -100 | -100 | -100 |
| Tax Rate, % | 29.02 | 29.02 | 29.02 | 29.02 | 29.02 | 29.02 | 29.02 | 29.02 | 29.02 | 29.02 |
| EBITAT | 110.3 | 17.1 | 146.0 | 142.4 | 281.3 | 208.4 | 252.6 | 306.1 | 370.9 | 449.4 |
| Depreciation | ||||||||||
| Changes in Account Receivables | ||||||||||
| Changes in Inventories | ||||||||||
| Changes in Accounts Payable | ||||||||||
| Capital Expenditure | ||||||||||
| UFCF | -577.2 | -549.1 | -497.6 | -644.4 | -655.9 | -323.7 | -301.0 | -364.8 | -442.0 | -535.6 |
| WACC, % | 6.66 | 5.36 | 6.57 | 6.19 | 6.45 | 6.24 | 6.24 | 6.24 | 6.24 | 6.24 |
| PV UFCF | ||||||||||
| SUM PV UFCF | -1,618.0 | |||||||||
| Long Term Growth Rate, % | 2.00 | |||||||||
| Free cash flow (T + 1) | -546 | |||||||||
| Terminal Value | -12,870 | |||||||||
| Present Terminal Value | -9,507 | |||||||||
| Enterprise Value | -11,125 | |||||||||
| Net Debt | 3,015 | |||||||||
| Equity Value | -14,140 | |||||||||
| Diluted Shares Outstanding, MM | 144 | |||||||||
| Equity Value Per Share | -98.19 |
What You Will Receive
- Authentic NEOEN Financial Data: Pre-loaded with Neoen S.A.'s historical and projected figures for accurate analysis.
- Completely Customizable Template: Easily adjust key inputs such as revenue growth, WACC, and EBITDA %.
- Real-Time Calculations: Watch as Neoen's intrinsic value refreshes immediately based on your modifications.
- Expert Valuation Tool: Tailored for investors, analysts, and consultants aiming for precise DCF outcomes.
- Intuitive Design: A straightforward layout and clear guidelines suitable for all skill levels.
Key Features
- 🔍 Real-Life NEOEN Financials: Pre-filled historical and projected data for Neoen S.A. (NEOENPA).
- ✏️ Fully Customizable Inputs: Modify essential parameters (yellow cells) such as WACC, growth %, and tax rates.
- 📊 Professional DCF Valuation: Integrated formulas compute Neoen’s intrinsic value using the Discounted Cash Flow method.
- ⚡ Instant Results: View Neoen’s valuation immediately after adjustments are made.
- Scenario Analysis: Evaluate and contrast outcomes for different financial assumptions side-by-side.
How It Functions
- 1. Access the Template: Download and open the Excel file containing Neoen S.A.'s (NEOENPA) preloaded data.
- 2. Adjust Key Inputs: Modify essential parameters such as growth projections, WACC, and capital expenditures.
- 3. Instantly View Results: The DCF model automatically calculates intrinsic value and NPV in real-time.
- 4. Explore Various Scenarios: Evaluate different forecasts to assess a range of valuation results.
- 5. Present with Assurance: Deliver professional valuation analyses to back your strategic decisions.
Why Opt for This Calculator?
- Designed for Experts: A sophisticated tool favored by analysts, CFOs, and consultants.
- Accurate Data: Neoen S.A.'s historical and forecasted financial information is preloaded for precision.
- Scenario Analysis: Effortlessly simulate various forecasts and assumptions.
- Transparent Results: Automatically computes intrinsic value, NPV, and critical financial metrics.
- User-Friendly: Detailed step-by-step guidance to assist you throughout the process.
Who Can Benefit from This Product?
- Finance Students: Discover valuation techniques and practice them using real-time data.
- Academics: Integrate professional models into your coursework or research projects.
- Investors: Validate your assumptions and assess valuation outcomes for Neoen S.A. (NEOENPA) stock.
- Analysts: Enhance your efficiency with a customizable, ready-to-use DCF model.
- Small Business Owners: Understand how major public companies like Neoen S.A. (NEOENPA) are evaluated.
Contents of the Template
- Pre-Filled Data: Features Neoen S.A.'s historical financial performance and projections.
- Discounted Cash Flow Model: Editable DCF valuation model with integrated calculations.
- Weighted Average Cost of Capital (WACC): A specific sheet for calculating WACC using personalized inputs.
- Key Financial Ratios: Assess Neoen S.A.'s profitability, operational efficiency, and leverage metrics.
- Customizable Inputs: Easily modify revenue growth rates, profit margins, and tax assumptions.
- Clear Dashboard: Visual representations and tables summarizing essential valuation outcomes.
Disclaimer
All information, articles, and product details provided on this website are for general informational and educational purposes only. We do not claim any ownership over, nor do we intend to infringe upon, any trademarks, copyrights, logos, brand names, or other intellectual property mentioned or depicted on this site. Such intellectual property remains the property of its respective owners, and any references here are made solely for identification or informational purposes, without implying any affiliation, endorsement, or partnership.
We make no representations or warranties, express or implied, regarding the accuracy, completeness, or suitability of any content or products presented. Nothing on this website should be construed as legal, tax, investment, financial, medical, or other professional advice. In addition, no part of this site—including articles or product references—constitutes a solicitation, recommendation, endorsement, advertisement, or offer to buy or sell any securities, franchises, or other financial instruments, particularly in jurisdictions where such activity would be unlawful.
All content is of a general nature and may not address the specific circumstances of any individual or entity. It is not a substitute for professional advice or services. Any actions you take based on the information provided here are strictly at your own risk. You accept full responsibility for any decisions or outcomes arising from your use of this website and agree to release us from any liability in connection with your use of, or reliance upon, the content or products found herein.