
|
Valoración DCF de NewMarket Corporation (NEU) |
Completamente Editable: Adáptelo A Sus Necesidades En Excel O Sheets
Diseño Profesional: Plantillas Confiables Y Estándares De La Industria
Predeterminadas Para Un Uso Rápido Y Eficiente
Compatible con MAC / PC, completamente desbloqueado
No Se Necesita Experiencia; Fáciles De Seguir
NewMarket Corporation (NEU) Bundle
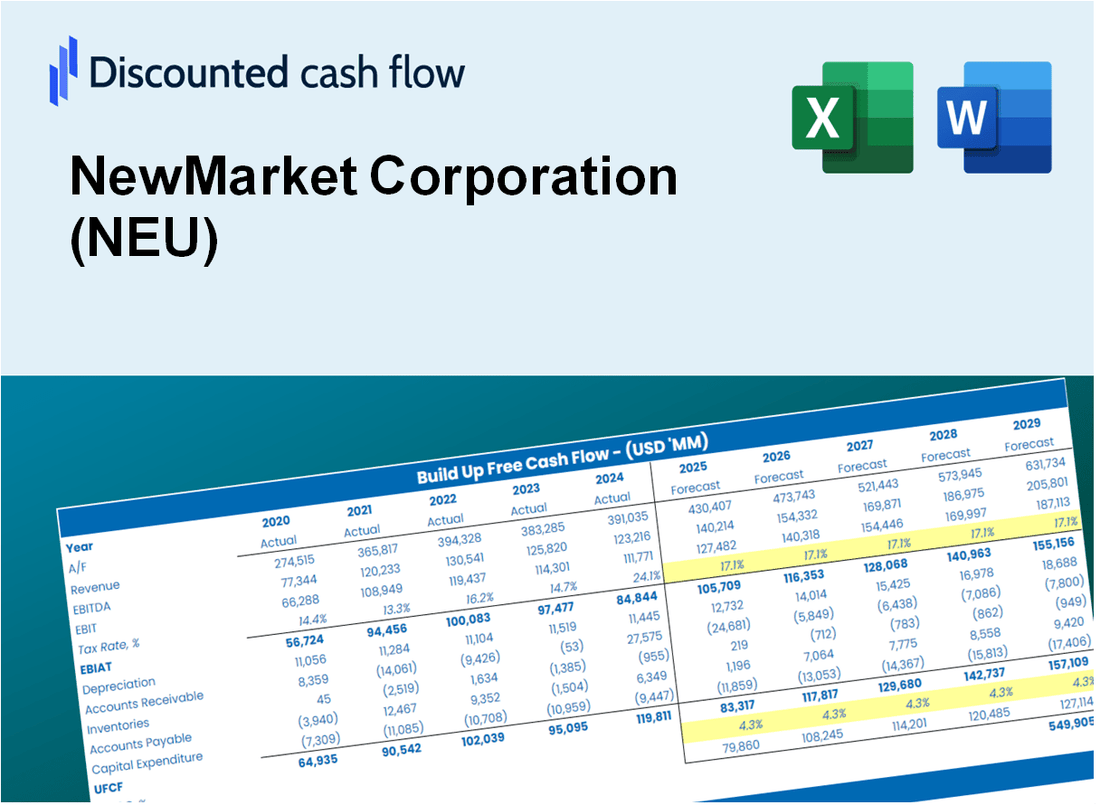
Como inversionista o analista, la calculadora DCF de Newmarket Corporation (NEU) es su recurso para una valoración precisa. Equipado con datos reales de NewMarket Corporation, puede ajustar los pronósticos y observar los efectos inmediatos.
Discounted Cash Flow (DCF) - (USD MM)
| Year | AY1 2020 |
AY2 2021 |
AY3 2022 |
AY4 2023 |
AY5 2024 |
FY1 2025 |
FY2 2026 |
FY3 2027 |
FY4 2028 |
FY5 2029 |
|---|---|---|---|---|---|---|---|---|---|---|
| Revenue | 2,010.9 | 2,356.1 | 2,764.8 | 2,698.4 | 2,786.6 | 3,033.0 | 3,301.2 | 3,593.2 | 3,911.0 | 4,256.9 |
| Revenue Growth, % | 0 | 17.17 | 17.35 | -2.4 | 3.27 | 8.84 | 8.84 | 8.84 | 8.84 | 8.84 |
| EBITDA | 441.6 | 401.1 | 465.2 | 604.3 | 758.4 | 639.5 | 696.1 | 757.6 | 824.6 | 897.6 |
| EBITDA, % | 21.96 | 17.02 | 16.83 | 22.4 | 27.22 | 21.08 | 21.08 | 21.08 | 21.08 | 21.08 |
| Depreciation | 84.0 | 119.3 | 82.3 | 78.0 | 117.0 | 117.1 | 127.5 | 138.7 | 151.0 | 164.4 |
| Depreciation, % | 4.18 | 5.06 | 2.98 | 2.89 | 4.2 | 3.86 | 3.86 | 3.86 | 3.86 | 3.86 |
| EBIT | 357.6 | 281.8 | 382.9 | 526.3 | 641.5 | 522.4 | 568.6 | 618.9 | 673.6 | 733.2 |
| EBIT, % | 17.78 | 11.96 | 13.85 | 19.5 | 23.02 | 17.22 | 17.22 | 17.22 | 17.22 | 17.22 |
| Total Cash | 125.2 | 459.2 | 68.7 | 111.9 | 77.5 | 213.1 | 231.9 | 252.5 | 274.8 | 299.1 |
| Total Cash, percent | .0 | .0 | .0 | .0 | .0 | .0 | .0 | .0 | .0 | .0 |
| Account Receivables | 336.4 | 391.8 | 453.7 | 432.3 | 395.5 | 485.2 | 528.1 | 574.8 | 625.6 | 680.9 |
| Account Receivables, % | 16.73 | 16.63 | 16.41 | 16.02 | 14.19 | 16 | 16 | 16 | 16 | 16 |
| Inventories | 401.0 | 498.5 | 631.4 | 456.2 | 505.4 | 600.4 | 653.5 | 711.3 | 774.3 | 842.7 |
| Inventories, % | 19.94 | 21.16 | 22.84 | 16.91 | 18.14 | 19.8 | 19.8 | 19.8 | 19.8 | 19.8 |
| Accounts Payable | 189.9 | 246.1 | 273.3 | 231.1 | 225.9 | 281.7 | 306.7 | 333.8 | 363.3 | 395.4 |
| Accounts Payable, % | 9.45 | 10.45 | 9.88 | 8.57 | 8.11 | 9.29 | 9.29 | 9.29 | 9.29 | 9.29 |
| Capital Expenditure | -93.3 | -78.9 | -56.2 | -48.3 | -57.3 | -84.1 | -91.6 | -99.7 | -108.5 | -118.1 |
| Capital Expenditure, % | -4.64 | -3.35 | -2.03 | -1.79 | -2.06 | -2.77 | -2.77 | -2.77 | -2.77 | -2.77 |
| Tax Rate, % | 20.83 | 20.83 | 20.83 | 20.83 | 20.83 | 20.83 | 20.83 | 20.83 | 20.83 | 20.83 |
| EBITAT | 292.1 | 217.3 | 307.8 | 418.6 | 507.8 | 415.7 | 452.5 | 492.5 | 536.0 | 583.4 |
| Depreciation | ||||||||||
| Changes in Account Receivables | ||||||||||
| Changes in Inventories | ||||||||||
| Changes in Accounts Payable | ||||||||||
| Capital Expenditure | ||||||||||
| UFCF | -264.7 | 161.0 | 166.4 | 602.6 | 549.9 | 319.8 | 417.3 | 454.2 | 494.3 | 538.0 |
| WACC, % | 5.72 | 5.69 | 5.71 | 5.7 | 5.7 | 5.7 | 5.7 | 5.7 | 5.7 | 5.7 |
| PV UFCF | ||||||||||
| SUM PV UFCF | 1,864.2 | |||||||||
| Long Term Growth Rate, % | 0.50 | |||||||||
| Free cash flow (T + 1) | 541 | |||||||||
| Terminal Value | 10,391 | |||||||||
| Present Terminal Value | 7,874 | |||||||||
| Enterprise Value | 9,739 | |||||||||
| Net Debt | 982 | |||||||||
| Equity Value | 8,757 | |||||||||
| Diluted Shares Outstanding, MM | 10 | |||||||||
| Equity Value Per Share | 915.91 |
What You Will Receive
- Customizable Excel Template: A fully adaptable Excel-based DCF Calculator featuring pre-populated financials for NewMarket Corporation (NEU).
- Accurate Historical Data: Access to past performance metrics and future projections (highlighted in the yellow cells).
- Assumption Flexibility: Modify key forecast parameters such as revenue growth, EBITDA %, and WACC.
- Instant Calculations: Quickly observe how your inputs affect NewMarket Corporation's (NEU) valuation.
- Professional Resource: Designed for investors, CFOs, consultants, and financial analysts.
- User-Centric Design: Organized for clarity and ease of navigation, complete with step-by-step guidance.
Key Features
- Customizable Financial Inputs: Adjust essential metrics such as revenue growth, operating margin, and capital investments.
- Instant DCF Valuation: Quickly computes intrinsic value, net present value (NPV), and additional financial metrics.
- High-Precision Accuracy: Leverages NewMarket Corporation’s (NEU) actual financial data for credible valuation results.
- Effortless Scenario Analysis: Evaluate various assumptions and analyze results with ease.
- Efficiency Booster: Remove the hassle of constructing intricate valuation models from the ground up.
How It Works
- Step 1: Download the Excel file.
- Step 2: Review pre-entered NewMarket Corporation (NEU) data (historical and projected).
- Step 3: Adjust key assumptions (yellow cells) based on your analysis.
- Step 4: View automatic recalculations for NewMarket Corporation’s intrinsic value.
- Step 5: Use the outputs for investment decisions or reporting.
Why Choose This Calculator for NewMarket Corporation (NEU)?
- Designed for Experts: A sophisticated tool utilized by financial analysts, CFOs, and industry consultants.
- Accurate Data: Historical and projected financials for NewMarket Corporation (NEU) preloaded for precision.
- Forecast Simulations: Effortlessly test various scenarios and assumptions.
- Comprehensive Outputs: Automatically computes intrinsic value, NPV, and essential financial metrics.
- User-Friendly: Step-by-step guidance ensures a smooth calculation process.
Who Should Use This Product?
- Individual Investors: Make informed decisions about buying or selling NewMarket Corporation (NEU) stock.
- Financial Analysts: Streamline valuation processes with ready-to-use financial models tailored for NewMarket Corporation (NEU).
- Consultants: Deliver professional valuation insights on NewMarket Corporation (NEU) to clients quickly and accurately.
- Business Owners: Understand how companies like NewMarket Corporation (NEU) are valued to guide your own business strategy.
- Finance Students: Learn valuation techniques using real-world data and scenarios related to NewMarket Corporation (NEU).
What the Template Contains
- Pre-Filled DCF Model: NewMarket Corporation’s (NEU) financial data preloaded for immediate use.
- WACC Calculator: Detailed calculations for Weighted Average Cost of Capital.
- Financial Ratios: Evaluate NewMarket Corporation’s (NEU) profitability, leverage, and efficiency.
- Editable Inputs: Change assumptions such as growth, margins, and CAPEX to fit your scenarios.
- Financial Statements: Annual and quarterly reports to support detailed analysis.
- Interactive Dashboard: Easily visualize key valuation metrics and results.
Disclaimer
All information, articles, and product details provided on this website are for general informational and educational purposes only. We do not claim any ownership over, nor do we intend to infringe upon, any trademarks, copyrights, logos, brand names, or other intellectual property mentioned or depicted on this site. Such intellectual property remains the property of its respective owners, and any references here are made solely for identification or informational purposes, without implying any affiliation, endorsement, or partnership.
We make no representations or warranties, express or implied, regarding the accuracy, completeness, or suitability of any content or products presented. Nothing on this website should be construed as legal, tax, investment, financial, medical, or other professional advice. In addition, no part of this site—including articles or product references—constitutes a solicitation, recommendation, endorsement, advertisement, or offer to buy or sell any securities, franchises, or other financial instruments, particularly in jurisdictions where such activity would be unlawful.
All content is of a general nature and may not address the specific circumstances of any individual or entity. It is not a substitute for professional advice or services. Any actions you take based on the information provided here are strictly at your own risk. You accept full responsibility for any decisions or outcomes arising from your use of this website and agree to release us from any liability in connection with your use of, or reliance upon, the content or products found herein.