
|
Nexans S.A. (Nex.PA) Valoración de DCF |
Completamente Editable: Adáptelo A Sus Necesidades En Excel O Sheets
Diseño Profesional: Plantillas Confiables Y Estándares De La Industria
Predeterminadas Para Un Uso Rápido Y Eficiente
Compatible con MAC / PC, completamente desbloqueado
No Se Necesita Experiencia; Fáciles De Seguir
Nexans S.A. (NEX.PA) Bundle
¡Descubra el verdadero potencial de Nexans S.A. (NEXPA) con nuestra calculadora DCF avanzada! Ajuste los supuestos esenciales, explore varios escenarios y evalúe cómo los cambios afectan la valoración de Nexans S.A. (NEXPA), todo dentro de una plantilla integral de Excel.
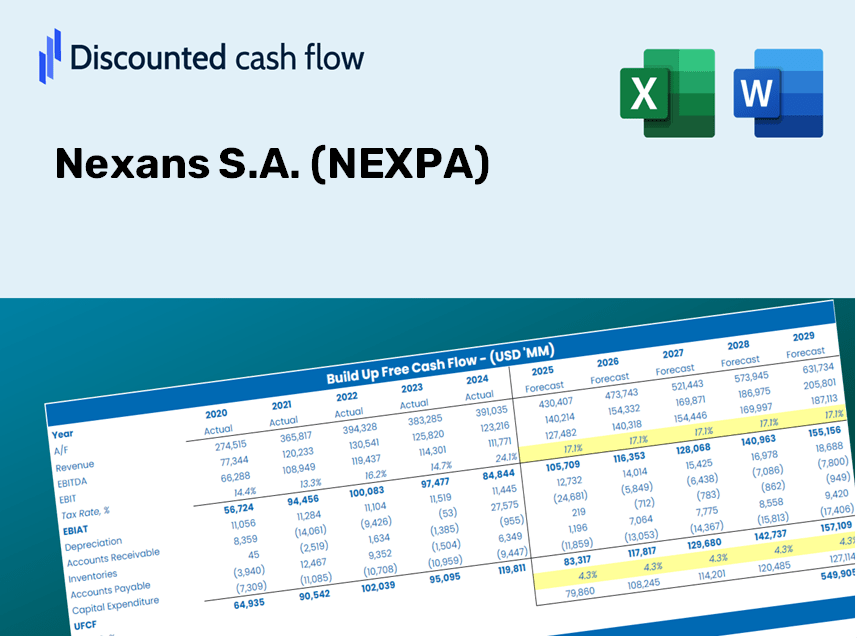
Discounted Cash Flow (DCF) - (USD MM)
| Year | AY1 2020 |
AY2 2021 |
AY3 2022 |
AY4 2023 |
AY5 2024 |
FY1 2025 |
FY2 2026 |
FY3 2027 |
FY4 2028 |
FY5 2029 |
|---|---|---|---|---|---|---|---|---|---|---|
| Revenue | 5,979.0 | 7,374.0 | 8,369.0 | 7,790.0 | 8,546.0 | 9,392.3 | 10,322.4 | 11,344.6 | 12,468.1 | 13,702.7 |
| Revenue Growth, % | 0 | 23.33 | 13.49 | -6.92 | 9.7 | 9.9 | 9.9 | 9.9 | 9.9 | 9.9 |
| EBITDA | 391.0 | 421.0 | 554.0 | 528.0 | 667.0 | 628.4 | 690.6 | 759.0 | 834.1 | 916.7 |
| EBITDA, % | 6.54 | 5.71 | 6.62 | 6.78 | 7.8 | 6.69 | 6.69 | 6.69 | 6.69 | 6.69 |
| Depreciation | 154.0 | 162.0 | 178.0 | 178.0 | 214.0 | 219.6 | 241.3 | 265.2 | 291.5 | 320.3 |
| Depreciation, % | 2.58 | 2.2 | 2.13 | 2.28 | 2.5 | 2.34 | 2.34 | 2.34 | 2.34 | 2.34 |
| EBIT | 237.0 | 259.0 | 376.0 | 350.0 | 453.0 | 408.8 | 449.3 | 493.8 | 542.7 | 596.4 |
| EBIT, % | 3.96 | 3.51 | 4.49 | 4.49 | 5.3 | 4.35 | 4.35 | 4.35 | 4.35 | 4.35 |
| Total Cash | 1,142.0 | 972.0 | 1,134.0 | 1,131.0 | 1,254.0 | 1,409.3 | 1,548.9 | 1,702.2 | 1,870.8 | 2,056.1 |
| Total Cash, percent | .0 | .0 | .0 | .0 | .0 | .0 | .0 | .0 | .0 | .0 |
| Account Receivables | 1,094.0 | 1,148.0 | 1,360.0 | 1,244.0 | 1,570.0 | 1,586.5 | 1,743.6 | 1,916.3 | 2,106.0 | 2,314.6 |
| Account Receivables, % | 18.3 | 15.57 | 16.25 | 15.97 | 18.37 | 16.89 | 16.89 | 16.89 | 16.89 | 16.89 |
| Inventories | 937.0 | 1,316.0 | 1,432.0 | 1,319.0 | 1,279.0 | 1,550.2 | 1,703.7 | 1,872.5 | 2,057.9 | 2,261.7 |
| Inventories, % | 15.67 | 17.85 | 17.11 | 16.93 | 14.97 | 16.51 | 16.51 | 16.51 | 16.51 | 16.51 |
| Accounts Payable | 1,213.0 | 1,622.0 | 1,735.0 | 1,601.0 | 1,622.0 | 1,926.3 | 2,117.1 | 2,326.7 | 2,557.1 | 2,810.3 |
| Accounts Payable, % | 20.29 | 22 | 20.73 | 20.55 | 18.98 | 20.51 | 20.51 | 20.51 | 20.51 | 20.51 |
| Capital Expenditure | -225.0 | -206.0 | -298.0 | -377.0 | -378.0 | -364.0 | -400.1 | -439.7 | -483.3 | -531.1 |
| Capital Expenditure, % | -3.76 | -2.79 | -3.56 | -4.84 | -4.42 | -3.88 | -3.88 | -3.88 | -3.88 | -3.88 |
| Tax Rate, % | 29.9 | 29.9 | 29.9 | 29.9 | 29.9 | 29.9 | 29.9 | 29.9 | 29.9 | 29.9 |
| EBITAT | 96.3 | 179.2 | 271.7 | 265.8 | 317.6 | 268.3 | 294.9 | 324.1 | 356.1 | 391.4 |
| Depreciation | ||||||||||
| Changes in Account Receivables | ||||||||||
| Changes in Inventories | ||||||||||
| Changes in Accounts Payable | ||||||||||
| Capital Expenditure | ||||||||||
| UFCF | -792.7 | 111.2 | -63.3 | 161.8 | -111.4 | 140.4 | 16.2 | 17.8 | 19.6 | 21.5 |
| WACC, % | 6.75 | 7.02 | 7.05 | 7.08 | 7.03 | 6.98 | 6.98 | 6.98 | 6.98 | 6.98 |
| PV UFCF | ||||||||||
| SUM PV UFCF | 190.2 | |||||||||
| Long Term Growth Rate, % | 2.00 | |||||||||
| Free cash flow (T + 1) | 22 | |||||||||
| Terminal Value | 440 | |||||||||
| Present Terminal Value | 314 | |||||||||
| Enterprise Value | 504 | |||||||||
| Net Debt | 680 | |||||||||
| Equity Value | -176 | |||||||||
| Diluted Shares Outstanding, MM | 45 | |||||||||
| Equity Value Per Share | -3.90 |
What You Will Receive
- Authentic NEXPA Financial Data: Pre-loaded with Nexans S.A.'s historical and forecasted data for accurate analysis.
- Completely Customizable Template: Easily adjust key inputs such as revenue growth, WACC, and EBITDA percentage.
- Instantaneous Calculations: Watch the intrinsic value of Nexans S.A. update in real-time as you make modifications.
- Expert Valuation Tool: Tailored for investors, analysts, and consultants aiming for precise DCF results.
- Intuitive User Experience: Straightforward layout and clear guidance suitable for users of all skill levels.
Key Features
- 🔍 Real-Life NEXPA Financials: Access pre-filled historical and projected data for Nexans S.A.
- ✏️ Fully Customizable Inputs: Modify all essential parameters (highlighted cells) such as WACC, growth %, and tax rates.
- 📊 Professional DCF Valuation: Utilize integrated formulas to determine Nexans' intrinsic value through the Discounted Cash Flow method.
- ⚡ Instant Results: Immediately visualize Nexans' valuation after implementing changes.
- Scenario Analysis: Evaluate and contrast outcomes for different financial assumptions side-by-side.
How It Works
- Download: Obtain the pre-formatted Excel file containing Nexans S.A. (NEXPA) financial data.
- Customize: Modify forecasts, including revenue growth, EBITDA %, and WACC as per your analysis.
- Update Automatically: Watch as the intrinsic value and NPV calculations update in real-time.
- Test Scenarios: Develop various projections and instantly compare the outcomes.
- Make Decisions: Utilize the valuation findings to inform your investment strategy.
Why Opt for This Calculator?
- All-in-One Solution: Combines DCF, WACC, and financial ratio analysis in a single tool.
- Tailorable Inputs: Modify the highlighted cells to explore different scenarios.
- In-Depth Analysis: Automatically computes the intrinsic value and Net Present Value for Nexans S.A. (NEXPA).
- Preloaded Information: Historical and projected data provide reliable starting points.
- High-Quality Standards: Perfect for financial analysts, investors, and business consultants.
Who Should Use Nexans S.A. (NEXPA)?
- Engineering Students: Discover methodologies in electrical infrastructure and apply them with real-world examples.
- Researchers: Utilize industry-standard models in your academic projects or studies.
- Investors: Validate your hypotheses and assess valuation projections for Nexans S.A. (NEXPA).
- Market Analysts: Enhance your analysis process with a customizable DCF model tailored for Nexans S.A. (NEXPA).
- Entrepreneurs: Understand the evaluation methods used for large firms like Nexans S.A. (NEXPA).
Contents of the Template
- Pre-Filled Data: Features Nexans S.A.'s historical financial performance and projections.
- Discounted Cash Flow Model: Customizable DCF valuation model with automatic calculations included.
- Weighted Average Cost of Capital (WACC): A dedicated section for calculating WACC based on user-defined inputs.
- Key Financial Ratios: Assess Nexans S.A.'s profitability, efficiency, and financial leverage.
- Customizable Inputs: Easily modify revenue growth, profit margins, and tax rates.
- Clear Dashboard: Visualizations and tables that summarize essential valuation outcomes.
Disclaimer
All information, articles, and product details provided on this website are for general informational and educational purposes only. We do not claim any ownership over, nor do we intend to infringe upon, any trademarks, copyrights, logos, brand names, or other intellectual property mentioned or depicted on this site. Such intellectual property remains the property of its respective owners, and any references here are made solely for identification or informational purposes, without implying any affiliation, endorsement, or partnership.
We make no representations or warranties, express or implied, regarding the accuracy, completeness, or suitability of any content or products presented. Nothing on this website should be construed as legal, tax, investment, financial, medical, or other professional advice. In addition, no part of this site—including articles or product references—constitutes a solicitation, recommendation, endorsement, advertisement, or offer to buy or sell any securities, franchises, or other financial instruments, particularly in jurisdictions where such activity would be unlawful.
All content is of a general nature and may not address the specific circumstances of any individual or entity. It is not a substitute for professional advice or services. Any actions you take based on the information provided here are strictly at your own risk. You accept full responsibility for any decisions or outcomes arising from your use of this website and agree to release us from any liability in connection with your use of, or reliance upon, the content or products found herein.