
|
Narayana Hrudayalaya Limited (NH.NS) DCF Valoración |
Completamente Editable: Adáptelo A Sus Necesidades En Excel O Sheets
Diseño Profesional: Plantillas Confiables Y Estándares De La Industria
Predeterminadas Para Un Uso Rápido Y Eficiente
Compatible con MAC / PC, completamente desbloqueado
No Se Necesita Experiencia; Fáciles De Seguir
Narayana Hrudayalaya Limited (NH.NS) Bundle
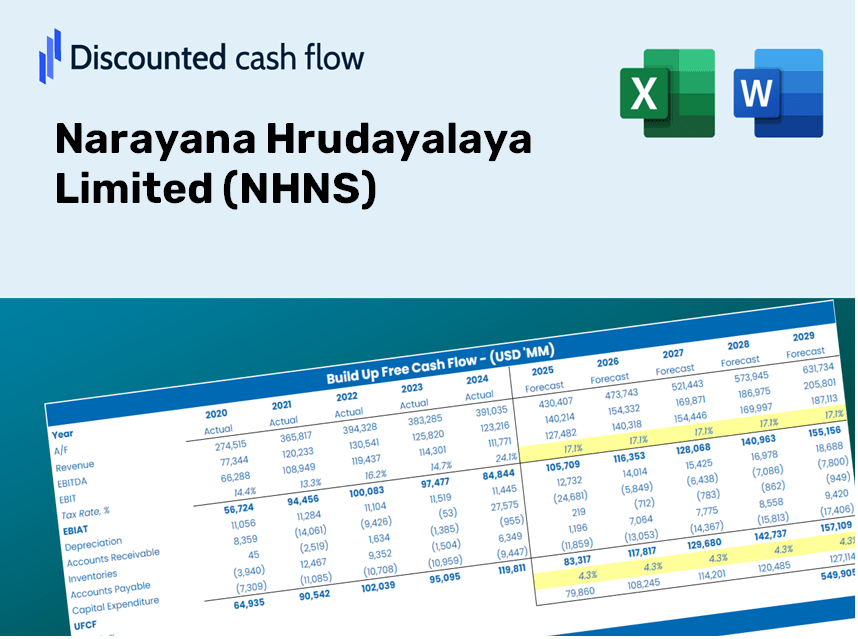
¡Agilice su análisis y mejore la precisión con nuestra calculadora DCF (NHNS)! Utilizando datos reales de los supuestos limitados y personalizables de Narayana Hrudayalaya, esta herramienta le permite pronosticar, analizar y evaluar (NHNS) como un inversor experimentado.
Discounted Cash Flow (DCF) - (USD MM)
| Year | AY1 2021 |
AY2 2022 |
AY3 2023 |
AY4 2024 |
AY5 2025 |
FY1 2026 |
FY2 2027 |
FY3 2028 |
FY4 2029 |
FY5 2030 |
|---|---|---|---|---|---|---|---|---|---|---|
| Revenue | 25,839.2 | 37,013.2 | 45,296.6 | 48,903.1 | 54,829.8 | 66,577.7 | 80,842.8 | 98,164.4 | 119,197.4 | 144,736.9 |
| Revenue Growth, % | 0 | 43.24 | 22.38 | 7.96 | 12.12 | 21.43 | 21.43 | 21.43 | 21.43 | 21.43 |
| EBITDA | 1,428.2 | 6,191.0 | 9,307.4 | 11,019.5 | 12,282.4 | 11,682.5 | 14,185.6 | 17,225.0 | 20,915.7 | 25,397.2 |
| EBITDA, % | 5.53 | 16.73 | 20.55 | 22.53 | 22.4 | 17.55 | 17.55 | 17.55 | 17.55 | 17.55 |
| Depreciation | 1,359.6 | 1,378.8 | 1,634.4 | 1,895.3 | 2,254.9 | 2,740.8 | 3,328.0 | 4,041.1 | 4,906.9 | 5,958.3 |
| Depreciation, % | 5.26 | 3.73 | 3.61 | 3.88 | 4.11 | 4.12 | 4.12 | 4.12 | 4.12 | 4.12 |
| EBIT | 68.7 | 4,812.2 | 7,673.0 | 9,124.2 | 10,027.4 | 8,941.7 | 10,857.6 | 13,184.0 | 16,008.8 | 19,438.9 |
| EBIT, % | 0.26568 | 13 | 16.94 | 18.66 | 18.29 | 13.43 | 13.43 | 13.43 | 13.43 | 13.43 |
| Total Cash | 2,387.3 | 3,009.7 | 6,506.9 | 11,035.2 | 16,267.8 | 11,181.2 | 13,576.9 | 16,485.9 | 20,018.2 | 24,307.3 |
| Total Cash, percent | .0 | .0 | .0 | .0 | .0 | .0 | .0 | .0 | .0 | .0 |
| Account Receivables | 3,085.9 | 4,832.0 | 4,943.6 | 4,793.2 | 5,554.9 | 7,435.9 | 9,029.2 | 10,963.8 | 13,312.9 | 16,165.4 |
| Account Receivables, % | 11.94 | 13.05 | 10.91 | 9.8 | 10.13 | 11.17 | 11.17 | 11.17 | 11.17 | 11.17 |
| Inventories | 478.4 | 593.8 | 715.7 | 1,099.5 | 1,102.6 | 1,237.7 | 1,502.9 | 1,824.9 | 2,215.9 | 2,690.6 |
| Inventories, % | 1.85 | 1.6 | 1.58 | 2.25 | 2.01 | 1.86 | 1.86 | 1.86 | 1.86 | 1.86 |
| Accounts Payable | 3,697.4 | 4,490.3 | 6,150.4 | 6,035.7 | 5,744.5 | 8,367.2 | 10,160.0 | 12,336.9 | 14,980.2 | 18,189.9 |
| Accounts Payable, % | 14.31 | 12.13 | 13.58 | 12.34 | 10.48 | 12.57 | 12.57 | 12.57 | 12.57 | 12.57 |
| Capital Expenditure | -701.0 | -2,506.8 | -5,220.4 | -9,706.1 | -10,819.6 | -8,068.1 | -9,796.8 | -11,895.8 | -14,444.7 | -17,539.6 |
| Capital Expenditure, % | -2.71 | -6.77 | -11.53 | -19.85 | -19.73 | -12.12 | -12.12 | -12.12 | -12.12 | -12.12 |
| Tax Rate, % | 15.54 | 15.54 | 15.54 | 15.54 | 15.54 | 15.54 | 15.54 | 15.54 | 15.54 | 15.54 |
| EBITAT | 17.5 | 3,828.6 | 6,189.3 | 8,146.4 | 8,469.2 | 6,428.7 | 7,806.2 | 9,478.7 | 11,509.7 | 13,975.8 |
| Depreciation | ||||||||||
| Changes in Account Receivables | ||||||||||
| Changes in Inventories | ||||||||||
| Changes in Accounts Payable | ||||||||||
| Capital Expenditure | ||||||||||
| UFCF | 809.1 | 1,632.0 | 4,029.7 | -12.4 | -1,151.5 | 1,708.0 | 1,271.7 | 1,544.2 | 1,875.1 | 2,276.9 |
| WACC, % | 4.35 | 4.59 | 4.59 | 4.63 | 4.61 | 4.55 | 4.55 | 4.55 | 4.55 | 4.55 |
| PV UFCF | ||||||||||
| SUM PV UFCF | 7,539.7 | |||||||||
| Long Term Growth Rate, % | 4.00 | |||||||||
| Free cash flow (T + 1) | 2,368 | |||||||||
| Terminal Value | 427,929 | |||||||||
| Present Terminal Value | 342,517 | |||||||||
| Enterprise Value | 350,057 | |||||||||
| Net Debt | 17,816 | |||||||||
| Equity Value | 332,240 | |||||||||
| Diluted Shares Outstanding, MM | 203 | |||||||||
| Equity Value Per Share | 1,635.85 |
What You Will Receive
- Authentic NHNS Financials: Access historical and projected data for precise valuation.
- Customizable Inputs: Adjust WACC, tax rates, revenue growth, and capital expenditures as needed.
- Automated Calculations: Intrinsic value and NPV are computed in real-time.
- Scenario Analysis: Explore various scenarios to assess the future performance of Narayana Hrudayalaya Limited (NHNS).
- User-Friendly Design: Designed for professionals while remaining easy for newcomers to navigate.
Key Features
- Pre-Loaded Data: NHNS's historical financial statements and pre-filled forecasts.
- Fully Adjustable Inputs: Modify WACC, tax rates, revenue growth, and EBITDA margins.
- Instant Results: Witness NHNS's intrinsic value recalculating in real time.
- Clear Visual Outputs: Dashboard charts showcase valuation results and essential metrics.
- Built for Accuracy: A professional tool designed for analysts, investors, and finance experts.
How It Operates
- Step 1: Download the prebuilt Excel template featuring Narayana Hrudayalaya Limited's (NHNS) data.
- Step 2: Review the pre-filled sheets to familiarize yourself with the essential metrics.
- Step 3: Modify forecasts and assumptions in the editable yellow cells (WACC, growth, margins).
- Step 4: Instantly observe the recalibrated results, including Narayana Hrudayalaya Limited's intrinsic value.
- Step 5: Make informed investment decisions or create reports using the generated outputs.
Why Opt for Narayana Hrudayalaya Limited (NHNS)?
- Time-Efficient: Skip the hassle of building a financial model from the ground up – it's readily available for your use.
- Enhanced Precision: Dependable financial metrics and calculations minimize valuation discrepancies.
- Completely Adaptable: Adjust the model to align with your specific assumptions and forecasts.
- User-Friendly: Intuitive charts and outputs allow for straightforward analysis of results.
- Expert Endorsement: Crafted for professionals who prioritize accuracy and ease of use.
Who Should Consider Using This Product?
- Professional Investors: Develop comprehensive and dependable valuation models for analyzing portfolios involving Narayana Hrudayalaya Limited (NHNS).
- Corporate Finance Teams: Evaluate valuation scenarios to inform and shape internal strategies.
- Consultants and Advisors: Equip clients with precise valuation insights for Narayana Hrudayalaya Limited (NHNS) stock.
- Students and Educators: Utilize real-world data to enhance learning and practice in financial modeling.
- Healthcare Industry Enthusiasts: Gain insights into how healthcare companies like Narayana Hrudayalaya Limited (NHNS) are valued in the market.
Contents of the Template
- Operating and Balance Sheet Data: Pre-filled historical data and forecasts for Narayana Hrudayalaya Limited (NHNS), including revenue, EBITDA, EBIT, and capital expenditures.
- WACC Calculation: A dedicated worksheet for the Weighted Average Cost of Capital (WACC), featuring parameters such as Beta, risk-free rate, and share price.
- DCF Valuation (Unlevered and Levered): Customizable Discounted Cash Flow models that illustrate the intrinsic value with comprehensive calculations.
- Financial Statements: Pre-loaded annual and quarterly financial statements for Narayana Hrudayalaya Limited (NHNS) to facilitate analysis.
- Key Ratios: A collection of profitability, leverage, and efficiency ratios specific to Narayana Hrudayalaya Limited (NHNS).
- Dashboard and Charts: A visual summary of valuation outputs and underlying assumptions to simplify result analysis.
Disclaimer
All information, articles, and product details provided on this website are for general informational and educational purposes only. We do not claim any ownership over, nor do we intend to infringe upon, any trademarks, copyrights, logos, brand names, or other intellectual property mentioned or depicted on this site. Such intellectual property remains the property of its respective owners, and any references here are made solely for identification or informational purposes, without implying any affiliation, endorsement, or partnership.
We make no representations or warranties, express or implied, regarding the accuracy, completeness, or suitability of any content or products presented. Nothing on this website should be construed as legal, tax, investment, financial, medical, or other professional advice. In addition, no part of this site—including articles or product references—constitutes a solicitation, recommendation, endorsement, advertisement, or offer to buy or sell any securities, franchises, or other financial instruments, particularly in jurisdictions where such activity would be unlawful.
All content is of a general nature and may not address the specific circumstances of any individual or entity. It is not a substitute for professional advice or services. Any actions you take based on the information provided here are strictly at your own risk. You accept full responsibility for any decisions or outcomes arising from your use of this website and agree to release us from any liability in connection with your use of, or reliance upon, the content or products found herein.