
|
NHPC Limited (NHPC.NS) DCF Valuation |
Completamente Editable: Adáptelo A Sus Necesidades En Excel O Sheets
Diseño Profesional: Plantillas Confiables Y Estándares De La Industria
Predeterminadas Para Un Uso Rápido Y Eficiente
Compatible con MAC / PC, completamente desbloqueado
No Se Necesita Experiencia; Fáciles De Seguir
NHPC Limited (NHPC.NS) Bundle
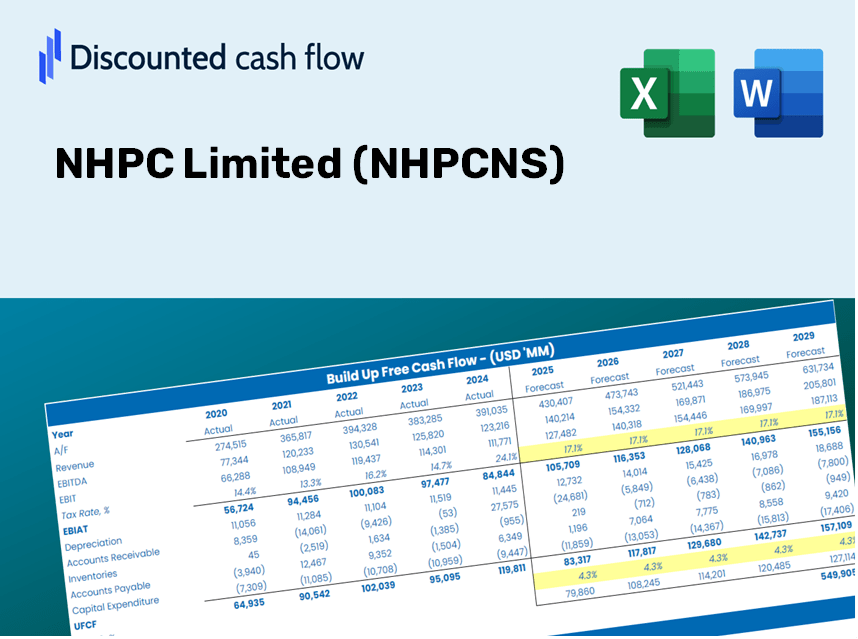
Make informed investment choices with the NHPC Limited (NHPCNS) DCF Calculator! Explore real NHPC financial data, adjust growth predictions and expenses, and immediately observe how these alterations affect NHPC Limited's intrinsic value.
Discounted Cash Flow (DCF) - (USD MM)
| Year | AY1 2021 |
AY2 2022 |
AY3 2023 |
AY4 2024 |
AY5 2025 |
FY1 2026 |
FY2 2027 |
FY3 2028 |
FY4 2029 |
FY5 2030 |
|---|---|---|---|---|---|---|---|---|---|---|
| Revenue | 84,336.7 | 82,786.4 | 93,525.4 | 84,606.5 | 103,798.6 | 110,099.5 | 116,782.9 | 123,872.0 | 131,391.5 | 139,367.4 |
| Revenue Growth, % | 0 | -1.84 | 12.97 | -9.54 | 22.68 | 6.07 | 6.07 | 6.07 | 6.07 | 6.07 |
| EBITDA | 61,955.7 | 60,885.4 | 68,617.3 | 62,506.4 | 59,291.8 | 77,372.7 | 82,069.4 | 87,051.3 | 92,335.6 | 97,940.7 |
| EBITDA, % | 73.46 | 73.55 | 73.37 | 73.88 | 57.12 | 70.28 | 70.28 | 70.28 | 70.28 | 70.28 |
| Depreciation | 12,924.6 | 11,903.0 | 12,146.7 | 11,841.3 | 11,930.4 | 15,013.2 | 15,924.5 | 16,891.2 | 17,916.6 | 19,004.2 |
| Depreciation, % | 15.33 | 14.38 | 12.99 | 14 | 11.49 | 13.64 | 13.64 | 13.64 | 13.64 | 13.64 |
| EBIT | 49,031.1 | 48,982.4 | 56,470.6 | 50,665.1 | 47,361.4 | 62,359.5 | 66,144.9 | 70,160.1 | 74,419.1 | 78,936.5 |
| EBIT, % | 58.14 | 59.17 | 60.38 | 59.88 | 45.63 | 56.64 | 56.64 | 56.64 | 56.64 | 56.64 |
| Total Cash | 21,442.4 | 17,278.2 | 37,871.0 | 36,348.1 | 27,509.4 | 34,406.6 | 36,495.2 | 38,710.6 | 41,060.5 | 43,553.0 |
| Total Cash, percent | .0 | .0 | .0 | .0 | .0 | .0 | .0 | .0 | .0 | .0 |
| Account Receivables | 64,659.8 | 62,029.4 | 62,213.6 | 59,749.3 | 47,931.5 | 73,747.7 | 78,224.4 | 82,972.9 | 88,009.7 | 93,352.1 |
| Account Receivables, % | 76.67 | 74.93 | 66.52 | 70.62 | 46.18 | 66.98 | 66.98 | 66.98 | 66.98 | 66.98 |
| Inventories | 1,336.9 | 1,404.4 | 1,611.8 | 1,900.8 | 2,571.1 | 2,142.2 | 2,272.3 | 2,410.2 | 2,556.5 | 2,711.7 |
| Inventories, % | 1.59 | 1.7 | 1.72 | 2.25 | 2.48 | 1.95 | 1.95 | 1.95 | 1.95 | 1.95 |
| Accounts Payable | 2,098.6 | 2,141.1 | 2,348.2 | 2,821.8 | 3,213.9 | 3,086.5 | 3,273.9 | 3,472.6 | 3,683.4 | 3,907.0 |
| Accounts Payable, % | 2.49 | 2.59 | 2.51 | 3.34 | 3.1 | 2.8 | 2.8 | 2.8 | 2.8 | 2.8 |
| Capital Expenditure | -19,819.6 | -50,144.8 | -49,601.6 | -69,971.4 | -88,514.1 | -67,179.3 | -71,257.3 | -75,582.8 | -80,171.0 | -85,037.6 |
| Capital Expenditure, % | -23.5 | -60.57 | -53.04 | -82.7 | -85.27 | -61.02 | -61.02 | -61.02 | -61.02 | -61.02 |
| Tax Rate, % | 33.03 | 33.03 | 33.03 | 33.03 | 33.03 | 33.03 | 33.03 | 33.03 | 33.03 | 33.03 |
| EBITAT | 36,603.9 | 38,982.6 | 41,972.5 | 39,439.6 | 31,716.7 | 46,567.1 | 49,393.9 | 52,392.3 | 55,572.7 | 58,946.1 |
| Depreciation | ||||||||||
| Changes in Account Receivables | ||||||||||
| Changes in Inventories | ||||||||||
| Changes in Accounts Payable | ||||||||||
| Capital Expenditure | ||||||||||
| UFCF | -34,189.2 | 3,346.2 | 4,333.1 | -16,041.6 | -33,327.4 | -31,113.7 | -10,358.2 | -10,987.0 | -11,654.0 | -12,361.4 |
| WACC, % | 3.97 | 4.04 | 3.97 | 4.02 | 3.87 | 3.97 | 3.97 | 3.97 | 3.97 | 3.97 |
| PV UFCF | ||||||||||
| SUM PV UFCF | -69,426.8 | |||||||||
| Long Term Growth Rate, % | 4.00 | |||||||||
| Free cash flow (T + 1) | -12,856 | |||||||||
| Terminal Value | 47,968,521 | |||||||||
| Present Terminal Value | 39,477,468 | |||||||||
| Enterprise Value | 39,408,041 | |||||||||
| Net Debt | 408,131 | |||||||||
| Equity Value | 38,999,910 | |||||||||
| Diluted Shares Outstanding, MM | 10,056 | |||||||||
| Equity Value Per Share | 3,878.37 |
Benefits You Will Receive
- Customizable Excel Template: A fully editable Excel-based DCF Calculator featuring pre-populated financials for NHPC Limited (NHPCNS).
- Real Data Insights: Access to historical performance data and future estimates (highlighted in the yellow cells).
- Flexible Forecasting: Modify assumptions such as revenue growth, EBITDA margin, and WACC according to your analysis.
- Instant Calculations: Quickly observe how changes in your inputs affect the valuation of NHPC Limited (NHPCNS).
- Professional Resource: Designed for investors, CFOs, consultants, and financial analysts.
- User-Friendly Interface: Organized for simplicity and ease of navigation, complete with step-by-step guidance.
Key Features
- Comprehensive DCF Calculator: Features detailed unlevered and levered DCF valuation models tailored for NHPC Limited (NHPCNS).
- WACC Calculator: Pre-configured Weighted Average Cost of Capital sheet with options for customizable inputs.
- Adjustable Forecast Assumptions: Easily modify growth rates, capital expenditures, and discount rates.
- Integrated Financial Ratios: Assess profitability, leverage, and efficiency ratios specific to NHPC Limited (NHPCNS).
- Interactive Dashboard and Charts: Visual representations that summarize critical valuation metrics for straightforward analysis.
How It Works
- Step 1: Download the Excel file.
- Step 2: Examine NHPC Limited’s (NHPCNS) pre-filled financial data and forecasts.
- Step 3: Adjust key inputs such as revenue growth, WACC, and tax rates (highlighted cells).
- Step 4: Observe the DCF model update in real-time as you modify your assumptions.
- Step 5: Review the results and utilize them for informed investment decisions.
Why Choose This Calculator for NHPC Limited (NHPCNS)?
- Designed for Experts: A sophisticated tool utilized by financial analysts, CFOs, and consultants.
- Accurate Financial Data: NHPC’s historical and estimated financial figures come preloaded for precision.
- Forecast Simulation: Easily test various scenarios and assumptions for better insights.
- Concise Results: Automatically computes intrinsic value, NPV, and other essential metrics.
- User-Friendly: Detailed step-by-step instructions lead you through each stage of the process.
Who Should Benefit from NHPC Limited (NHPCNS)?
- Individual Investors: Gain insights to make well-informed decisions regarding investments in NHPC Limited.
- Financial Analysts: Enhance valuation methodologies with accessible financial models tailored for NHPC Limited.
- Consultants: Provide timely and precise valuation insights about NHPC Limited to your clients.
- Business Owners: Learn from the valuation strategies of major players like NHPC Limited to refine your own business approach.
- Finance Students: Develop your understanding of valuation techniques using real data and case studies related to NHPC Limited.
Contents of the NHPC Limited Template
- Pre-Filled Data: Contains NHPC Limited’s historical financials and projections.
- Discounted Cash Flow Model: Editable DCF valuation model with automatic calculations included.
- Weighted Average Cost of Capital (WACC): A specific sheet for calculating WACC based on customized inputs.
- Key Financial Ratios: Evaluate NHPC Limited's profitability, efficiency, and financial leverage.
- Customizable Inputs: Easily modify revenue growth, profit margins, and tax rates.
- Clear Dashboard: Visuals and tables summarizing essential valuation outcomes.
Disclaimer
All information, articles, and product details provided on this website are for general informational and educational purposes only. We do not claim any ownership over, nor do we intend to infringe upon, any trademarks, copyrights, logos, brand names, or other intellectual property mentioned or depicted on this site. Such intellectual property remains the property of its respective owners, and any references here are made solely for identification or informational purposes, without implying any affiliation, endorsement, or partnership.
We make no representations or warranties, express or implied, regarding the accuracy, completeness, or suitability of any content or products presented. Nothing on this website should be construed as legal, tax, investment, financial, medical, or other professional advice. In addition, no part of this site—including articles or product references—constitutes a solicitation, recommendation, endorsement, advertisement, or offer to buy or sell any securities, franchises, or other financial instruments, particularly in jurisdictions where such activity would be unlawful.
All content is of a general nature and may not address the specific circumstances of any individual or entity. It is not a substitute for professional advice or services. Any actions you take based on the information provided here are strictly at your own risk. You accept full responsibility for any decisions or outcomes arising from your use of this website and agree to release us from any liability in connection with your use of, or reliance upon, the content or products found herein.