
|
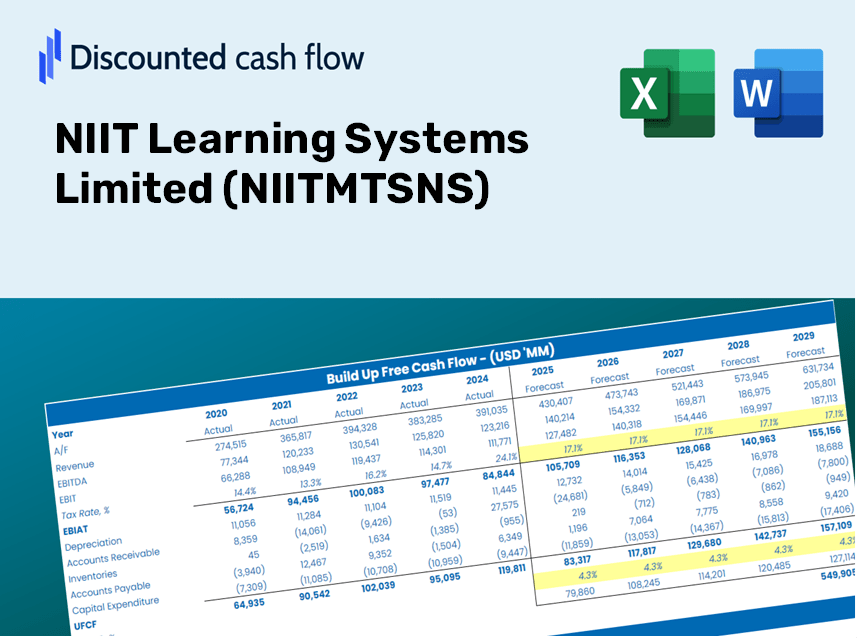
Valoración de DCF de NIIT Learning Systems Limited (NIITMTS.NS) |
Completamente Editable: Adáptelo A Sus Necesidades En Excel O Sheets
Diseño Profesional: Plantillas Confiables Y Estándares De La Industria
Predeterminadas Para Un Uso Rápido Y Eficiente
Compatible con MAC / PC, completamente desbloqueado
No Se Necesita Experiencia; Fáciles De Seguir
NIIT Learning Systems Limited (NIITMTS.NS) Bundle
¡Obtenga información sobre su análisis de valoración NIIT Learning Systems Limited (NIITMTSNS) utilizando nuestra calculadora sofisticada DCF! Esta plantilla de Excel viene precargada de datos reales (NIITMTSNS), lo que le permite ajustar preventos y supuestos para determinar el valor intrínseco de los sistemas de aprendizaje NIIT limitados con precisión.
What You Will Receive
- Customizable Excel Template: A fully adaptable Excel-based DCF Calculator featuring pre-filled financial data for NIIT Learning Systems Limited (NIITMTSNS).
- Accurate Data: Access to historical performance and projected estimates (highlighted in the yellow cells).
- Flexible Forecasting: Modify key assumptions such as revenue growth, EBITDA percentage, and WACC.
- Real-Time Calculations: Instantly observe how your inputs affect the valuation of NIIT Learning Systems Limited (NIITMTSNS).
- Professional Resource: Designed for investors, CFOs, consultants, and financial analysts.
- User-Centric Layout: Organized for clarity and simplicity, complete with step-by-step guidance.
Key Features
- Authentic NIITMTSNS Data: Includes comprehensive historical financials and forward-looking projections for NIIT Learning Systems Limited.
- Customizable Assumptions: Modify parameters such as revenue growth rates, profit margins, WACC, tax rates, and capital expenditures.
- Interactive Valuation Model: Automatic recalculation of Net Present Value (NPV) and intrinsic value based on your parameter adjustments.
- Scenario Analysis: Develop various forecasting scenarios to explore different valuation possibilities.
- User-Centric Interface: Intuitive and organized layout suitable for both seasoned professionals and newcomers.
How It Operates
- 1. Access the Template: Download and open the Excel file featuring NIIT Learning Systems Limited’s (NIITMTSNS) preloaded data.
- 2. Adjust Assumptions: Modify essential inputs such as growth rates, WACC, and capital expenditures.
- 3. Observe Results Immediately: The DCF model automatically computes intrinsic value and NPV in real time.
- 4. Evaluate Scenarios: Analyze various forecasts to explore different valuation possibilities.
- 5. Utilize with Assurance: Present expert valuation insights to bolster your decision-making process.
Why Opt for NIITMTSNS Calculator?
- Precision: Based on authentic NIIT Learning Systems financials for reliable data.
- Versatility: Tailored for users to freely explore and adjust inputs.
- Efficiency: Avoid the complexity of creating a DCF model from the ground up.
- Expert-Level: Crafted with the precision and functionality suitable for top financial professionals.
- Intuitive: Simple to navigate, even for those new to financial modeling.
Who Can Benefit from NIIT Learning Systems Limited (NIITMTSNS)?
- Students: Acquire hands-on experience with industry-relevant techniques and applications.
- Researchers: Integrate cutting-edge models into your academic studies and publications.
- Investors: Evaluate your investment strategies and analyze performance metrics for NIIT Learning Systems Limited (NIITMTSNS).
- Financial Analysts: Optimize your analysis process with a tailor-made and adaptable financial model.
- Entrepreneurs: Understand the evaluation approaches used for established companies like NIIT Learning Systems Limited (NIITMTSNS).
Contents of the Template
- Pre-Filled Data: Contains NIIT Learning Systems Limited’s historical financials and forecasts.
- Discounted Cash Flow Model: Editable DCF valuation model with automated calculations.
- Weighted Average Cost of Capital (WACC): A specific sheet for calculating WACC based on user-defined inputs.
- Key Financial Ratios: Evaluate NIIT Learning Systems Limited’s profitability, operational efficiency, and financial leverage.
- Customizable Inputs: Easily modify revenue growth, profit margins, and tax rates.
- User-Friendly Dashboard: Visual representations including charts and tables summarizing essential valuation outcomes.
Disclaimer
All information, articles, and product details provided on this website are for general informational and educational purposes only. We do not claim any ownership over, nor do we intend to infringe upon, any trademarks, copyrights, logos, brand names, or other intellectual property mentioned or depicted on this site. Such intellectual property remains the property of its respective owners, and any references here are made solely for identification or informational purposes, without implying any affiliation, endorsement, or partnership.
We make no representations or warranties, express or implied, regarding the accuracy, completeness, or suitability of any content or products presented. Nothing on this website should be construed as legal, tax, investment, financial, medical, or other professional advice. In addition, no part of this site—including articles or product references—constitutes a solicitation, recommendation, endorsement, advertisement, or offer to buy or sell any securities, franchises, or other financial instruments, particularly in jurisdictions where such activity would be unlawful.
All content is of a general nature and may not address the specific circumstances of any individual or entity. It is not a substitute for professional advice or services. Any actions you take based on the information provided here are strictly at your own risk. You accept full responsibility for any decisions or outcomes arising from your use of this website and agree to release us from any liability in connection with your use of, or reliance upon, the content or products found herein.