
|
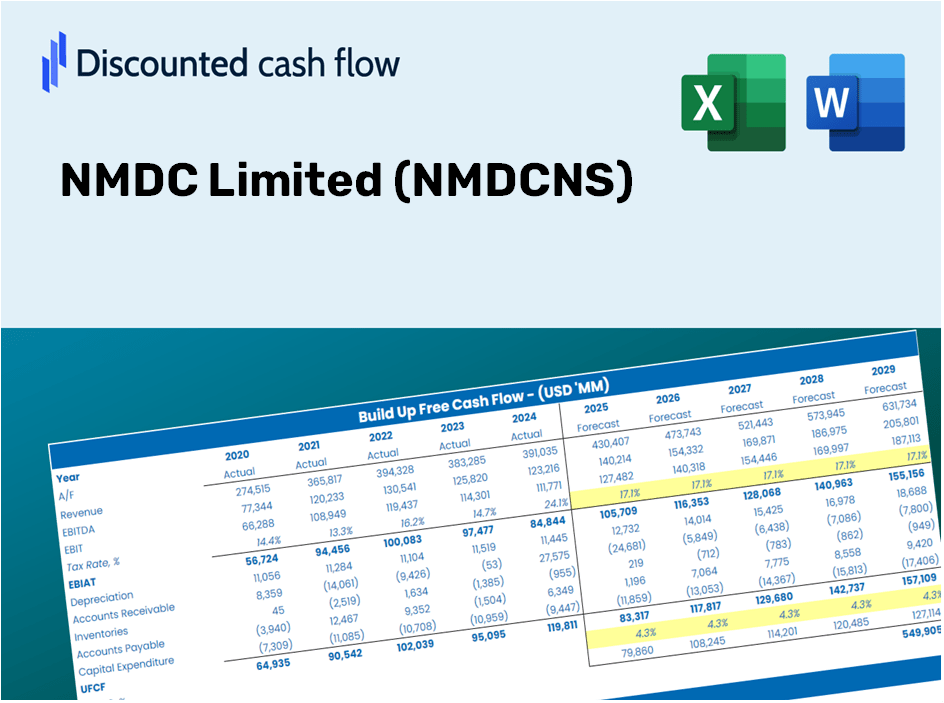
Valoración de DCF NMDC Limited (NMDC.NS) |
Completamente Editable: Adáptelo A Sus Necesidades En Excel O Sheets
Diseño Profesional: Plantillas Confiables Y Estándares De La Industria
Predeterminadas Para Un Uso Rápido Y Eficiente
Compatible con MAC / PC, completamente desbloqueado
No Se Necesita Experiencia; Fáciles De Seguir
NMDC Limited (NMDC.NS) Bundle
¡Explore las perspectivas financieras de NMDC Limited con nuestra calculadora DCF fácil de usar! Ingrese sus proyecciones para el crecimiento, los márgenes y los gastos para calcular el valor intrínseco de NMDC Limited e informar su estrategia de inversión.
Discounted Cash Flow (DCF) - (USD MM)
| Year | AY1 2021 |
AY2 2022 |
AY3 2023 |
AY4 2024 |
AY5 2025 |
FY1 2026 |
FY2 2027 |
FY3 2028 |
FY4 2029 |
FY5 2030 |
|---|---|---|---|---|---|---|---|---|---|---|
| Revenue | 153,700.6 | 259,647.9 | 176,668.8 | 213,078.5 | 239,055.2 | 280,754.1 | 329,726.6 | 387,241.4 | 454,788.7 | 534,118.4 |
| Revenue Growth, % | 0 | 68.93 | -31.96 | 20.61 | 12.19 | 17.44 | 17.44 | 17.44 | 17.44 | 17.44 |
| EBITDA | 92,377.9 | 134,891.0 | 82,321.7 | 85,274.0 | 97,419.9 | 134,437.8 | 157,888.0 | 185,428.8 | 217,773.5 | 255,760.1 |
| EBITDA, % | 60.1 | 51.95 | 46.6 | 40.02 | 40.75 | 47.88 | 47.88 | 47.88 | 47.88 | 47.88 |
| Depreciation | 3,256.4 | 4,338.5 | 5,103.3 | 4,965.0 | 4,204.2 | 6,045.8 | 7,100.3 | 8,338.9 | 9,793.4 | 11,501.7 |
| Depreciation, % | 2.12 | 1.67 | 2.89 | 2.33 | 1.76 | 2.15 | 2.15 | 2.15 | 2.15 | 2.15 |
| EBIT | 89,121.5 | 130,552.5 | 77,218.4 | 80,309.0 | 93,215.7 | 128,392.0 | 150,787.7 | 177,089.9 | 207,980.0 | 244,258.4 |
| EBIT, % | 57.98 | 50.28 | 43.71 | 37.69 | 38.99 | 45.73 | 45.73 | 45.73 | 45.73 | 45.73 |
| Total Cash | 37,227.0 | 68,228.6 | 70,337.1 | 122,175.5 | 98,069.4 | 105,941.3 | 124,420.9 | 146,123.8 | 171,612.5 | 201,547.2 |
| Total Cash, percent | .0 | .0 | .0 | .0 | .0 | .0 | .0 | .0 | .0 | .0 |
| Account Receivables | 21,398.9 | 29,543.0 | 43,612.3 | 35,089.3 | 77,985.2 | 55,632.3 | 65,336.3 | 76,733.1 | 90,117.8 | 105,837.2 |
| Account Receivables, % | 13.92 | 11.38 | 24.69 | 16.47 | 32.62 | 19.82 | 19.82 | 19.82 | 19.82 | 19.82 |
| Inventories | 9,217.2 | 21,252.1 | 26,605.8 | 27,669.5 | 26,377.2 | 29,906.5 | 35,123.2 | 41,249.8 | 48,445.1 | 56,895.4 |
| Inventories, % | 6 | 8.18 | 15.06 | 12.99 | 11.03 | 10.65 | 10.65 | 10.65 | 10.65 | 10.65 |
| Accounts Payable | 3,607.8 | 6,647.6 | 4,259.1 | 4,125.5 | 3,214.6 | 5,951.5 | 6,989.6 | 8,208.9 | 9,640.8 | 11,322.4 |
| Accounts Payable, % | 2.35 | 2.56 | 2.41 | 1.94 | 1.34 | 2.12 | 2.12 | 2.12 | 2.12 | 2.12 |
| Capital Expenditure | -16,221.1 | -11,983.4 | -12,472.2 | -18,470.9 | -32,303.4 | -24,936.7 | -29,286.4 | -34,394.9 | -40,394.5 | -47,440.5 |
| Capital Expenditure, % | -10.55 | -4.62 | -7.06 | -8.67 | -13.51 | -8.88 | -8.88 | -8.88 | -8.88 | -8.88 |
| Tax Rate, % | 28.46 | 28.46 | 28.46 | 28.46 | 28.46 | 28.46 | 28.46 | 28.46 | 28.46 | 28.46 |
| EBITAT | 62,887.4 | 94,570.0 | 56,090.1 | 56,299.1 | 66,691.0 | 91,745.9 | 107,749.3 | 126,544.3 | 148,617.6 | 174,541.3 |
| Depreciation | ||||||||||
| Changes in Account Receivables | ||||||||||
| Changes in Inventories | ||||||||||
| Changes in Accounts Payable | ||||||||||
| Capital Expenditure | ||||||||||
| UFCF | 22,914.4 | 69,785.9 | 26,909.7 | 50,118.9 | -3,922.7 | 94,415.5 | 71,680.7 | 84,184.1 | 98,868.5 | 116,114.3 |
| WACC, % | 7.23 | 7.24 | 7.24 | 7.23 | 7.23 | 7.23 | 7.23 | 7.23 | 7.23 | 7.23 |
| PV UFCF | ||||||||||
| SUM PV UFCF | 375,322.7 | |||||||||
| Long Term Growth Rate, % | 2.00 | |||||||||
| Free cash flow (T + 1) | 118,437 | |||||||||
| Terminal Value | 2,263,308 | |||||||||
| Present Terminal Value | 1,596,259 | |||||||||
| Enterprise Value | 1,971,582 | |||||||||
| Net Debt | 41,910 | |||||||||
| Equity Value | 1,929,672 | |||||||||
| Diluted Shares Outstanding, MM | 8,794 | |||||||||
| Equity Value Per Share | 219.43 |
What You Will Receive
- Authentic NMDC Financials: Access to both historical and projected data for precise valuation.
- Customizable Inputs: Adjust metrics such as WACC, tax rates, revenue growth, and capital expenditures.
- Automated Calculations: Intrinsic value and NPV are computed in real-time.
- Scenario Analysis: Evaluate various scenarios to assess NMDC's future performance.
- User-Friendly Design: Designed for professionals but easy for newcomers to navigate.
Key Features
- Comprehensive Data: NMDC Limited’s (NMDCNS) historical financial statements and pre-filled projections.
- Customizable Inputs: Adjust WACC, tax rates, revenue growth, and EBITDA margins to fit your analysis.
- Real-Time Results: Observe NMDC Limited’s intrinsic value recalculated instantly.
- Visual Output: Interactive dashboard charts illustrate valuation results and essential metrics.
- Engineered for Precision: A robust tool tailored for analysts, investors, and financial professionals.
How It Works
- Step 1: Download the prebuilt Excel template featuring NMDC Limited’s (NMDCNS) data.
- Step 2: Navigate through the pre-filled sheets to familiarize yourself with the essential metrics.
- Step 3: Revise forecasts and assumptions in the editable yellow cells (WACC, growth, margins).
- Step 4: Instantly see the recalculated results, including NMDC Limited’s (NMDCNS) intrinsic value.
- Step 5: Utilize the outputs to make informed investment choices or to create detailed reports.
Why Opt for This Calculator?
- Precise Information: Utilizes authentic NMDC Limited financial data for trustworthy valuation outcomes.
- Personalizable: Modify essential parameters such as growth rates, WACC, and tax rates to align with your forecasts.
- Efficient: Pre-configured calculations save you the hassle of building from the ground up.
- Professional-Quality Tool: Tailored for investors, analysts, and consultants.
- Easy to Use: User-friendly design and guided instructions provide accessibility for everyone.
Who Can Benefit from NMDC Limited (NMDCNS)?
- Investors: Make informed decisions with a high-quality valuation tool tailored for your needs.
- Financial Analysts: Streamline your workflow with a customizable DCF model that's ready to use.
- Consultants: Effortlessly modify the template for effective client presentations or detailed reports.
- Finance Enthusiasts: Enhance your grasp of valuation methods through practical, real-world examples.
- Educators and Students: Utilize this resource as a hands-on learning tool in finance courses.
Contents of the Template
- Pre-Filled Data: Features NMDC Limited's (NMDCNS) historical financial information and projections.
- Discounted Cash Flow Model: An editable DCF valuation model with automatic calculations included.
- Weighted Average Cost of Capital (WACC): A dedicated worksheet for WACC calculations based on your custom inputs.
- Key Financial Ratios: Evaluate NMDC Limited’s (NMDCNS) profitability, efficiency, and leverage metrics.
- Customizable Inputs: Easily modify revenue growth, margin percentages, and tax rates.
- Clear Dashboard: Visuals and tables providing a summary of essential valuation results.
Disclaimer
All information, articles, and product details provided on this website are for general informational and educational purposes only. We do not claim any ownership over, nor do we intend to infringe upon, any trademarks, copyrights, logos, brand names, or other intellectual property mentioned or depicted on this site. Such intellectual property remains the property of its respective owners, and any references here are made solely for identification or informational purposes, without implying any affiliation, endorsement, or partnership.
We make no representations or warranties, express or implied, regarding the accuracy, completeness, or suitability of any content or products presented. Nothing on this website should be construed as legal, tax, investment, financial, medical, or other professional advice. In addition, no part of this site—including articles or product references—constitutes a solicitation, recommendation, endorsement, advertisement, or offer to buy or sell any securities, franchises, or other financial instruments, particularly in jurisdictions where such activity would be unlawful.
All content is of a general nature and may not address the specific circumstances of any individual or entity. It is not a substitute for professional advice or services. Any actions you take based on the information provided here are strictly at your own risk. You accept full responsibility for any decisions or outcomes arising from your use of this website and agree to release us from any liability in connection with your use of, or reliance upon, the content or products found herein.