
|
NN Group N.V. (NN.As) Valoración de DCF |
Completamente Editable: Adáptelo A Sus Necesidades En Excel O Sheets
Diseño Profesional: Plantillas Confiables Y Estándares De La Industria
Predeterminadas Para Un Uso Rápido Y Eficiente
Compatible con MAC / PC, completamente desbloqueado
No Se Necesita Experiencia; Fáciles De Seguir
NN Group N.V. (NN.AS) Bundle
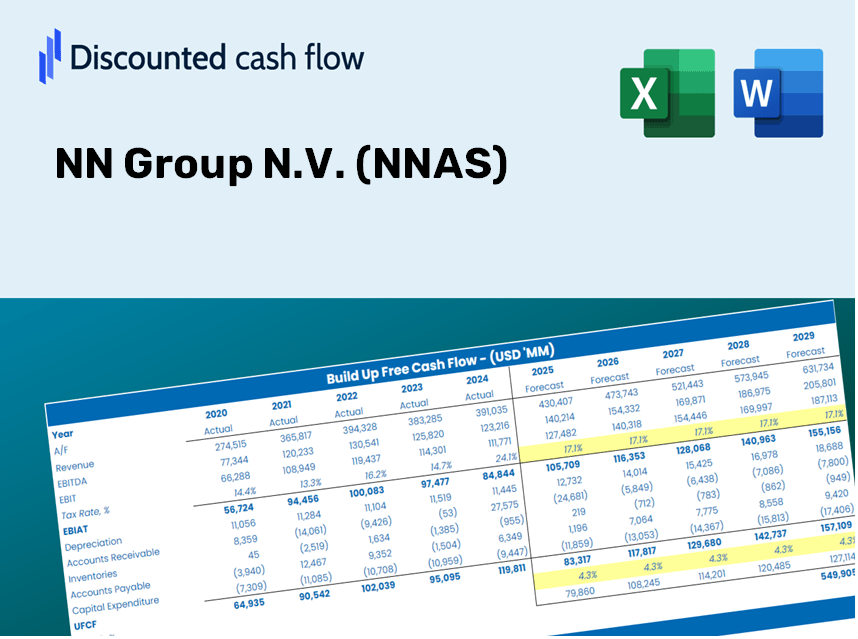
¡Simplifique la valoración del grupo NN N.V. (NNAS) con esta calculadora DCF personalizable! Con el Real NN Group N.V. (NNAS) Financials y las entradas de pronóstico ajustables, puede probar escenarios y descubrir el valor razonable del grupo NN NN N.V. (NNAS) en minutos.
Discounted Cash Flow (DCF) - (USD MM)
| Year | AY1 2020 |
AY2 2021 |
AY3 2022 |
AY4 2023 |
AY5 2024 |
FY1 2025 |
FY2 2026 |
FY3 2027 |
FY4 2028 |
FY5 2029 |
|---|---|---|---|---|---|---|---|---|---|---|
| Revenue | 18,005.0 | 19,009.0 | -833.0 | 10,806.0 | 12,620.0 | 7,015.6 | 3,900.0 | 2,168.0 | 1,205.2 | 670.0 |
| Revenue Growth, % | 0 | 5.58 | -104.38 | -1397.24 | 16.79 | -44.41 | -44.41 | -44.41 | -44.41 | -44.41 |
| EBITDA | 2,864.0 | 4,503.0 | 1,383.0 | 2,717.0 | 9,417.0 | 552.2 | 307.0 | 170.7 | 94.9 | 52.7 |
| EBITDA, % | 15.91 | 23.69 | -166.03 | 25.14 | 74.62 | 7.87 | 7.87 | 7.87 | 7.87 | 7.87 |
| Depreciation | 157.0 | 150.0 | 146.0 | 152.0 | .0 | -202.9 | -112.8 | -62.7 | -34.9 | -19.4 |
| Depreciation, % | 0.87198 | 0.7891 | -17.53 | 1.41 | 0 | -2.89 | -2.89 | -2.89 | -2.89 | -2.89 |
| EBIT | 2,707.0 | 4,353.0 | 1,237.0 | 2,565.0 | 9,417.0 | 509.2 | 283.1 | 157.4 | 87.5 | 48.6 |
| EBIT, % | 15.03 | 22.9 | -148.5 | 23.74 | 74.62 | 7.26 | 7.26 | 7.26 | 7.26 | 7.26 |
| Total Cash | 130,557.0 | 114,812.0 | 88,563.0 | 118,307.0 | 112,978.0 | 4,209.3 | 2,340.0 | 1,300.8 | 723.1 | 402.0 |
| Total Cash, percent | .0 | .0 | .0 | .0 | .0 | .0 | .0 | .0 | .0 | .0 |
| Account Receivables | .0 | .0 | .0 | .0 | .0 | .0 | .0 | .0 | .0 | .0 |
| Account Receivables, % | 0 | 0 | 0 | 0 | 0 | 0 | 0 | 0 | 0 | 0 |
| Inventories | .0 | .0 | .0 | .0 | .0 | .0 | .0 | .0 | .0 | .0 |
| Inventories, % | 0 | 0 | 0 | 0 | 0 | 0 | 0 | 0 | 0 | 0 |
| Accounts Payable | 1,002.0 | 802.0 | 830.0 | 11,244.0 | .0 | 142.3 | 79.1 | 44.0 | 24.5 | 13.6 |
| Accounts Payable, % | 5.57 | 4.22 | -99.64 | 104.05 | 0 | 2.03 | 2.03 | 2.03 | 2.03 | 2.03 |
| Capital Expenditure | -51.0 | -47.0 | -38.0 | .0 | .0 | -7.4 | -4.1 | -2.3 | -1.3 | -.7 |
| Capital Expenditure, % | -0.28325 | -0.24725 | 4.56 | 0 | 0 | -0.1061 | -0.1061 | -0.1061 | -0.1061 | -0.1061 |
| Tax Rate, % | 18.23 | 18.23 | 18.23 | 18.23 | 18.23 | 18.23 | 18.23 | 18.23 | 18.23 | 18.23 |
| EBITAT | 2,347.1 | 3,723.7 | 3,119.2 | 1,962.3 | 7,700.0 | 438.4 | 243.7 | 135.5 | 75.3 | 41.9 |
| Depreciation | ||||||||||
| Changes in Account Receivables | ||||||||||
| Changes in Inventories | ||||||||||
| Changes in Accounts Payable | ||||||||||
| Capital Expenditure | ||||||||||
| UFCF | 3,455.1 | 3,626.7 | 3,255.2 | 12,528.3 | -3,544.0 | 370.4 | 63.6 | 35.4 | 19.7 | 10.9 |
| WACC, % | 7.81 | 7.75 | 8.43 | 7.33 | 7.58 | 7.78 | 7.78 | 7.78 | 7.78 | 7.78 |
| PV UFCF | ||||||||||
| SUM PV UFCF | 448.8 | |||||||||
| Long Term Growth Rate, % | 2.00 | |||||||||
| Free cash flow (T + 1) | 11 | |||||||||
| Terminal Value | 193 | |||||||||
| Present Terminal Value | 133 | |||||||||
| Enterprise Value | 581 | |||||||||
| Net Debt | 4,600 | |||||||||
| Equity Value | -4,019 | |||||||||
| Diluted Shares Outstanding, MM | 272 | |||||||||
| Equity Value Per Share | -14.78 |
Benefits You Will Receive
- Genuine NN Group Financial Data: Comes pre-loaded with NN Group’s historical and forecasted data for accurate analysis.
- Completely Customizable Template: Easily adjust critical inputs such as revenue growth, WACC, and EBITDA %.
- Instant Calculations: Watch as NN Group’s intrinsic value updates automatically with your modifications.
- Expert Valuation Tool: Tailored for investors, analysts, and consultants who require precise DCF outcomes.
- Intuitive User Interface: Designed with a straightforward layout and clear guidance suitable for all skill levels.
Key Features
- Pre-Loaded Data: NN Group N.V.’s historical financial statements and pre-filled forecasts.
- Fully Adjustable Inputs: Customize WACC, tax rates, revenue growth, and EBITDA margins as needed.
- Instant Results: View NN Group N.V.'s intrinsic value recalculated in real time.
- Clear Visual Outputs: Dashboard charts present valuation results and essential metrics.
- Built for Accuracy: A professional tool designed for analysts, investors, and finance specialists.
How It Works
- Download the Template: Gain immediate access to the Excel-based NN Group N.V. DCF Calculator.
- Input Your Assumptions: Modify the yellow-highlighted cells to set growth rates, WACC, margins, and other factors.
- Instant Calculations: The model will automatically update the intrinsic value of NN Group N.V. (NNAS).
- Test Scenarios: Explore various assumptions to see how valuation changes under different conditions.
- Analyze and Decide: Utilize the findings to inform your investment or financial analysis.
Why Choose This Calculator for NN Group N.V. (NNAS)?
- All-in-One Tool: Features DCF, WACC, and comprehensive financial ratio analyses in a single solution.
- Flexible Inputs: Modify the yellow-highlighted fields to explore different financial scenarios.
- In-Depth Analysis: Automatically computes NN Group N.V.’s intrinsic value and Net Present Value.
- Preloaded Information: Historical data and forecasts provide a reliable foundation for analysis.
- High-Quality Standards: Perfect for financial analysts, investors, and business consultants focused on NNAS.
Who Can Benefit from This Product?
- Finance Students: Master valuation techniques and practice them using real-world data.
- Academics: Integrate industry-standard models into your teaching or research endeavors.
- Investors: Validate your hypotheses and analyze valuation scenarios for NN Group N.V. (NNAS).
- Analysts: Enhance your efficiency with a ready-to-use, customizable DCF model.
- Small Business Owners: Understand how major public companies like NN Group N.V. (NNAS) are evaluated.
Contents of the Template
- Historical Data: Comprises NN Group N.V. (NNAS) past financial performance and baseline forecasts.
- DCF and Levered DCF Models: Comprehensive templates to assess the intrinsic value of NN Group N.V. (NNAS).
- WACC Sheet: Pre-configured calculations for Weighted Average Cost of Capital.
- Editable Inputs: Customize essential parameters such as growth rates, EBITDA percentages, and CAPEX projections.
- Quarterly and Annual Statements: An in-depth analysis of NN Group N.V. (NNAS) financials.
- Interactive Dashboard: Dynamically visualize valuation outcomes and forecasts.
Disclaimer
All information, articles, and product details provided on this website are for general informational and educational purposes only. We do not claim any ownership over, nor do we intend to infringe upon, any trademarks, copyrights, logos, brand names, or other intellectual property mentioned or depicted on this site. Such intellectual property remains the property of its respective owners, and any references here are made solely for identification or informational purposes, without implying any affiliation, endorsement, or partnership.
We make no representations or warranties, express or implied, regarding the accuracy, completeness, or suitability of any content or products presented. Nothing on this website should be construed as legal, tax, investment, financial, medical, or other professional advice. In addition, no part of this site—including articles or product references—constitutes a solicitation, recommendation, endorsement, advertisement, or offer to buy or sell any securities, franchises, or other financial instruments, particularly in jurisdictions where such activity would be unlawful.
All content is of a general nature and may not address the specific circumstances of any individual or entity. It is not a substitute for professional advice or services. Any actions you take based on the information provided here are strictly at your own risk. You accept full responsibility for any decisions or outcomes arising from your use of this website and agree to release us from any liability in connection with your use of, or reliance upon, the content or products found herein.