
|
Valoración DCF de Nelnet, Inc. (NNI) |
Completamente Editable: Adáptelo A Sus Necesidades En Excel O Sheets
Diseño Profesional: Plantillas Confiables Y Estándares De La Industria
Predeterminadas Para Un Uso Rápido Y Eficiente
Compatible con MAC / PC, completamente desbloqueado
No Se Necesita Experiencia; Fáciles De Seguir
Nelnet, Inc. (NNI) Bundle
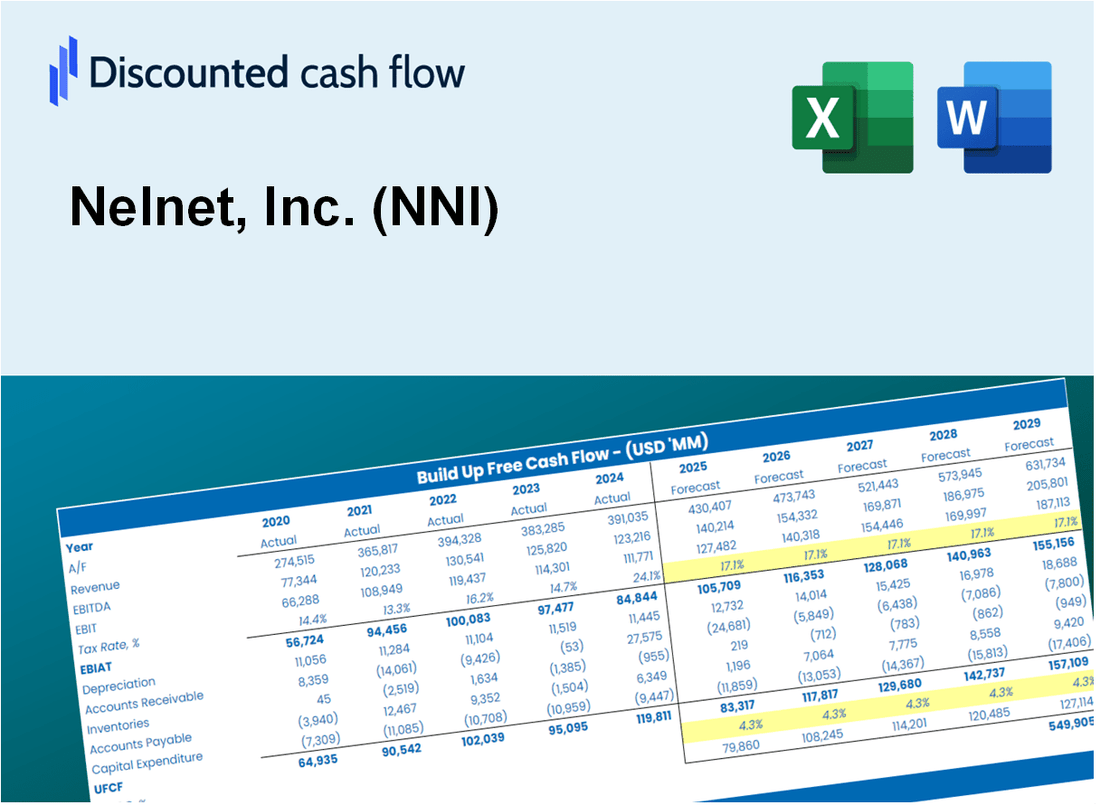
¡Evalúe las perspectivas financieras de Nelnet, Inc. (NNI) como un experto! Esta calculadora DCF (NNI) viene con datos financieros previamente llenos y ofrece una flexibilidad total para modificar el crecimiento de los ingresos, WACC, los márgenes y otros supuestos cruciales para alinearse con sus proyecciones.
Discounted Cash Flow (DCF) - (USD MM)
| Year | AY1 2020 |
AY2 2021 |
AY3 2022 |
AY4 2023 |
AY5 2024 |
FY1 2025 |
FY2 2026 |
FY3 2027 |
FY4 2028 |
FY5 2029 |
|---|---|---|---|---|---|---|---|---|---|---|
| Revenue | 1,372.6 | 1,417.8 | 1,816.9 | 1,814.4 | 1,846.7 | 1,999.4 | 2,164.7 | 2,343.8 | 2,537.6 | 2,747.5 |
| Revenue Growth, % | 0 | 3.29 | 28.15 | -0.1409 | 1.78 | 8.27 | 8.27 | 8.27 | 8.27 | 8.27 |
| EBITDA | 649.0 | 634.4 | 678.1 | 214.1 | 361.1 | 642.6 | 695.8 | 753.3 | 815.6 | 883.0 |
| EBITDA, % | 47.28 | 44.75 | 37.32 | 11.8 | 19.55 | 32.14 | 32.14 | 32.14 | 32.14 | 32.14 |
| Depreciation | 198.5 | 132.3 | 176.2 | 145.4 | 132.5 | 194.7 | 210.8 | 228.2 | 247.1 | 267.5 |
| Depreciation, % | 14.46 | 9.33 | 9.7 | 8.01 | 7.18 | 9.74 | 9.74 | 9.74 | 9.74 | 9.74 |
| EBIT | 450.5 | 502.1 | 501.8 | 68.7 | 228.6 | 447.9 | 485.0 | 525.1 | 568.5 | 615.5 |
| EBIT, % | 32.82 | 35.41 | 27.62 | 3.79 | 12.38 | 22.4 | 22.4 | 22.4 | 22.4 | 22.4 |
| Total Cash | 469.9 | 1,055.2 | 1,507.2 | 1,106.0 | 1,178.4 | 1,265.1 | 1,369.8 | 1,483.0 | 1,605.7 | 1,738.5 |
| Total Cash, percent | .0 | .0 | .0 | .0 | .0 | .0 | .0 | .0 | .0 | .0 |
| Account Receivables | 76.5 | 163.3 | 226.0 | 249.9 | 192.2 | 214.8 | 232.5 | 251.8 | 272.6 | 295.1 |
| Account Receivables, % | 5.57 | 11.52 | 12.44 | 13.78 | 10.41 | 10.74 | 10.74 | 10.74 | 10.74 | 10.74 |
| Inventories | .0 | .0 | .0 | .0 | .0 | .0 | .0 | .0 | .0 | .0 |
| Inventories, % | 0 | 0 | 0 | 0 | 0 | 0 | 0 | 0 | 0 | 0 |
| Accounts Payable | 28.7 | 4.6 | 36.0 | 35.4 | 21.0 | 29.9 | 32.4 | 35.1 | 38.0 | 41.1 |
| Accounts Payable, % | 2.09 | 0.32204 | 1.98 | 1.95 | 1.14 | 1.5 | 1.5 | 1.5 | 1.5 | 1.5 |
| Capital Expenditure | -113.3 | -59.0 | -59.4 | -74.1 | -20.9 | -83.6 | -90.5 | -98.0 | -106.1 | -114.8 |
| Capital Expenditure, % | -8.26 | -4.16 | -3.27 | -4.08 | -1.13 | -4.18 | -4.18 | -4.18 | -4.18 | -4.18 |
| Tax Rate, % | 19.48 | 19.48 | 19.48 | 19.48 | 19.48 | 19.48 | 19.48 | 19.48 | 19.48 | 19.48 |
| EBITAT | 352.4 | 393.3 | 406.9 | 89.8 | 184.0 | 374.6 | 405.6 | 439.1 | 475.5 | 514.8 |
| Depreciation | ||||||||||
| Changes in Account Receivables | ||||||||||
| Changes in Inventories | ||||||||||
| Changes in Accounts Payable | ||||||||||
| Capital Expenditure | ||||||||||
| UFCF | 389.8 | 355.7 | 492.6 | 136.5 | 339.1 | 472.0 | 510.6 | 552.8 | 598.6 | 648.1 |
| WACC, % | 6.86 | 6.87 | 7.01 | 8 | 6.98 | 7.15 | 7.15 | 7.15 | 7.15 | 7.15 |
| PV UFCF | ||||||||||
| SUM PV UFCF | 2,247.9 | |||||||||
| Long Term Growth Rate, % | 2.00 | |||||||||
| Free cash flow (T + 1) | 661 | |||||||||
| Terminal Value | 12,846 | |||||||||
| Present Terminal Value | 9,096 | |||||||||
| Enterprise Value | 11,344 | |||||||||
| Net Debt | 8,115 | |||||||||
| Equity Value | 3,229 | |||||||||
| Diluted Shares Outstanding, MM | 37 | |||||||||
| Equity Value Per Share | 88.12 |
What You Will Get
- Real NNI Financial Data: Pre-filled with Nelnet's historical and projected data for precise analysis.
- Fully Editable Template: Modify key inputs like revenue growth, WACC, and EBITDA % with ease.
- Automatic Calculations: See Nelnet’s intrinsic value update instantly based on your changes.
- Professional Valuation Tool: Designed for investors, analysts, and consultants seeking accurate DCF results.
- User-Friendly Design: Simple structure and clear instructions for all experience levels.
Key Features
- Customizable Financial Inputs: Adjust essential factors such as student loan growth, interest rates, and operational costs.
- Instant DCF Valuation: Quickly computes intrinsic value, NPV, and additional financial metrics.
- High-Precision Estimations: Leverages Nelnet's (NNI) actual financial data for accurate valuation results.
- Effortless Scenario Analysis: Easily evaluate various assumptions and assess their impact on outcomes.
- Efficiency-Boosting Solution: Removes the necessity of constructing intricate valuation models from the ground up.
How It Works
- Download the Template: Gain immediate access to the Excel-based NNI DCF Calculator.
- Input Your Assumptions: Modify the yellow-highlighted cells for growth rates, WACC, margins, and additional factors.
- Instant Calculations: The model automatically recalculates Nelnet’s intrinsic value.
- Test Scenarios: Experiment with various assumptions to assess potential changes in valuation.
- Analyze and Decide: Leverage the results to inform your investment or financial analysis.
Why Choose This Calculator for Nelnet, Inc. (NNI)?
- Accuracy: Utilizes real Nelnet financials for precise data representation.
- Flexibility: Built to allow users to experiment and adjust inputs with ease.
- Time-Saving: Eliminate the need to create a financial model from the ground up.
- Professional-Grade: Crafted with the expertise and usability expected by financial professionals.
- User-Friendly: Intuitive interface suitable for users of all financial backgrounds.
Who Should Use This Product?
- Investors: Evaluate Nelnet, Inc.'s (NNI) financial health before making investment decisions.
- CFOs and Financial Analysts: Enhance valuation methodologies and assess financial forecasts.
- Startup Founders: Understand the valuation strategies of established companies like Nelnet, Inc.
- Consultants: Provide clients with detailed valuation analyses and reports.
- Students and Educators: Utilize current data to learn and teach valuation principles effectively.
What the Template Contains
- Operating and Balance Sheet Data: Pre-filled Nelnet, Inc. (NNI) historical data and forecasts, including revenue, EBITDA, EBIT, and capital expenditures.
- WACC Calculation: A dedicated sheet for Weighted Average Cost of Capital (WACC), including parameters like Beta, risk-free rate, and share price.
- DCF Valuation (Unlevered and Levered): Editable Discounted Cash Flow models showing intrinsic value with detailed calculations.
- Financial Statements: Pre-loaded financial statements (annual and quarterly) to support analysis.
- Key Ratios: Includes profitability, leverage, and efficiency ratios for Nelnet, Inc. (NNI).
- Dashboard and Charts: Visual summary of valuation outputs and assumptions to analyze results easily.
Disclaimer
All information, articles, and product details provided on this website are for general informational and educational purposes only. We do not claim any ownership over, nor do we intend to infringe upon, any trademarks, copyrights, logos, brand names, or other intellectual property mentioned or depicted on this site. Such intellectual property remains the property of its respective owners, and any references here are made solely for identification or informational purposes, without implying any affiliation, endorsement, or partnership.
We make no representations or warranties, express or implied, regarding the accuracy, completeness, or suitability of any content or products presented. Nothing on this website should be construed as legal, tax, investment, financial, medical, or other professional advice. In addition, no part of this site—including articles or product references—constitutes a solicitation, recommendation, endorsement, advertisement, or offer to buy or sell any securities, franchises, or other financial instruments, particularly in jurisdictions where such activity would be unlawful.
All content is of a general nature and may not address the specific circumstances of any individual or entity. It is not a substitute for professional advice or services. Any actions you take based on the information provided here are strictly at your own risk. You accept full responsibility for any decisions or outcomes arising from your use of this website and agree to release us from any liability in connection with your use of, or reliance upon, the content or products found herein.