
|
Valoración DCF de Sunnova Energy International Inc. (NOVA) |
Completamente Editable: Adáptelo A Sus Necesidades En Excel O Sheets
Diseño Profesional: Plantillas Confiables Y Estándares De La Industria
Predeterminadas Para Un Uso Rápido Y Eficiente
Compatible con MAC / PC, completamente desbloqueado
No Se Necesita Experiencia; Fáciles De Seguir
Sunnova Energy International Inc. (NOVA) Bundle
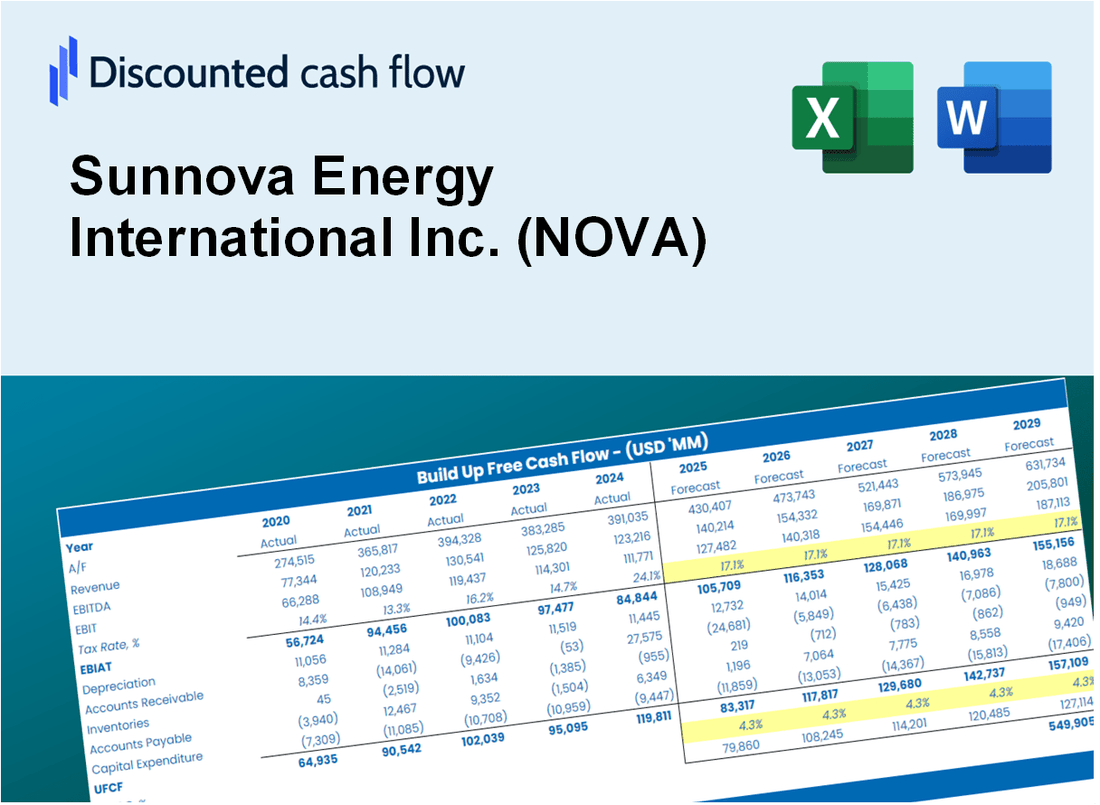
¡Evalúe las perspectivas financieras de Sunnova Energy International Inc. (NOVA) como un experto! Esta calculadora DCF (NOVA) viene con datos financieros previamente llenos y ofrece flexibilidad total para modificar el crecimiento de los ingresos, WACC, los márgenes y otros supuestos cruciales para alinearse con sus predicciones.
Discounted Cash Flow (DCF) - (USD MM)
| Year | AY1 2020 |
AY2 2021 |
AY3 2022 |
AY4 2023 |
AY5 2024 |
FY1 2025 |
FY2 2026 |
FY3 2027 |
FY4 2028 |
FY5 2029 |
|---|---|---|---|---|---|---|---|---|---|---|
| Revenue | 160.8 | 241.8 | 557.7 | 720.7 | 839.9 | 1,251.7 | 1,865.3 | 2,779.8 | 4,142.5 | 6,173.3 |
| Revenue Growth, % | 0 | 50.32 | 130.69 | 29.22 | 16.55 | 49.02 | 49.02 | 49.02 | 49.02 | 49.02 |
| EBITDA | -87.0 | 76.0 | 118.0 | 50.3 | 156.3 | 60.3 | 89.9 | 134.0 | 199.6 | 297.5 |
| EBITDA, % | -54.07 | 31.42 | 21.16 | 6.98 | 18.61 | 4.82 | 4.82 | 4.82 | 4.82 | 4.82 |
| Depreciation | 66.1 | 107.0 | 136.6 | 181.8 | 257.4 | 414.8 | 618.2 | 921.3 | 1,373.0 | 2,046.0 |
| Depreciation, % | 41.1 | 44.24 | 24.5 | 25.23 | 30.65 | 33.14 | 33.14 | 33.14 | 33.14 | 33.14 |
| EBIT | -153.1 | -31.0 | -18.6 | -131.5 | -101.1 | -354.5 | -528.3 | -787.4 | -1,173.3 | -1,748.6 |
| EBIT, % | -95.17 | -12.82 | -3.34 | -18.25 | -12.04 | -28.32 | -28.32 | -28.32 | -28.32 | -28.32 |
| Total Cash | 209.9 | 243.1 | 360.3 | 212.8 | 211.2 | 799.3 | 1,191.1 | 1,775.0 | 2,645.2 | 3,942.0 |
| Total Cash, percent | .0 | .0 | .0 | .0 | .0 | .0 | .0 | .0 | .0 | .0 |
| Account Receivables | 34.3 | 144.0 | 366.2 | 485.7 | 565.7 | 704.2 | 1,049.4 | 1,563.9 | 2,330.6 | 3,473.2 |
| Account Receivables, % | 21.31 | 59.56 | 65.67 | 67.4 | 67.35 | 56.26 | 56.26 | 56.26 | 56.26 | 56.26 |
| Inventories | 102.6 | 128.0 | 152.1 | 148.6 | .0 | 412.1 | 614.1 | 915.2 | 1,363.8 | 2,032.4 |
| Inventories, % | 63.79 | 52.93 | 27.28 | 20.62 | 0 | 32.92 | 32.92 | 32.92 | 32.92 | 32.92 |
| Accounts Payable | 39.9 | 55.0 | 116.1 | 355.8 | 699.4 | 503.3 | 750.0 | 1,117.7 | 1,665.7 | 2,482.2 |
| Accounts Payable, % | 24.82 | 22.76 | 20.82 | 49.37 | 83.27 | 40.21 | 40.21 | 40.21 | 40.21 | 40.21 |
| Capital Expenditure | -578.4 | -554.5 | -868.2 | -1,832.7 | -1,642.8 | -1,251.7 | -1,865.3 | -2,779.8 | -4,142.5 | -6,173.3 |
| Capital Expenditure, % | -359.64 | -229.38 | -155.68 | -254.31 | -195.59 | -100 | -100 | -100 | -100 | -100 |
| Tax Rate, % | 37.89 | 37.89 | 37.89 | 37.89 | 37.89 | 37.89 | 37.89 | 37.89 | 37.89 | 37.89 |
| EBITAT | -125.5 | -29.1 | -23.8 | -109.2 | -62.8 | -298.5 | -444.8 | -662.9 | -987.8 | -1,472.1 |
| Depreciation | ||||||||||
| Changes in Account Receivables | ||||||||||
| Changes in Inventories | ||||||||||
| Changes in Accounts Payable | ||||||||||
| Capital Expenditure | ||||||||||
| UFCF | -734.8 | -596.6 | -940.7 | -1,636.4 | -1,036.0 | -1,882.0 | -1,992.4 | -2,969.2 | -4,424.8 | -6,594.0 |
| WACC, % | 4.8 | 5.49 | 5.85 | 4.86 | 3.65 | 4.93 | 4.93 | 4.93 | 4.93 | 4.93 |
| PV UFCF | ||||||||||
| SUM PV UFCF | -15,006.9 | |||||||||
| Long Term Growth Rate, % | 2.00 | |||||||||
| Free cash flow (T + 1) | -6,726 | |||||||||
| Terminal Value | -229,534 | |||||||||
| Present Terminal Value | -180,445 | |||||||||
| Enterprise Value | -195,452 | |||||||||
| Net Debt | 8,249 | |||||||||
| Equity Value | -203,701 | |||||||||
| Diluted Shares Outstanding, MM | 124 | |||||||||
| Equity Value Per Share | -1,639.57 |
What You Will Get
- Real NOVA Financial Data: Pre-filled with Sunnova Energy’s historical and projected data for precise analysis.
- Fully Editable Template: Modify key inputs like revenue growth, WACC, and EBITDA % with ease.
- Automatic Calculations: See Sunnova Energy’s intrinsic value update instantly based on your changes.
- Professional Valuation Tool: Designed for investors, analysts, and consultants seeking accurate DCF results.
- User-Friendly Design: Simple structure and clear instructions for all experience levels.
Key Features
- Customizable Energy Forecasts: Adjust essential inputs such as solar energy production estimates, operational costs, and market growth rates.
- Instant DCF Valuation: Provides immediate calculations of intrinsic value, NPV, and other financial metrics.
- Industry-Leading Precision: Utilizes Sunnova's real-world performance data for accurate valuation results.
- Effortless Scenario Testing: Easily evaluate various assumptions and analyze the resulting impacts.
- Efficiency Booster: Streamlines the valuation process, removing the need for complex model creation from the ground up.
How It Works
- Step 1: Download the Excel file.
- Step 2: Review Sunnova Energy's pre-filled financial data and forecasts.
- Step 3: Adjust key inputs such as revenue growth, WACC, and tax rates (highlighted cells).
- Step 4: Observe the DCF model update in real-time as you modify assumptions.
- Step 5: Evaluate the outputs and leverage the results for investment decisions.
Why Choose Sunnova Energy International Inc. (NOVA)?
- Save Time: Quickly access solar energy solutions without lengthy research – we provide everything you need.
- Enhance Efficiency: Our innovative technology maximizes energy production and minimizes costs.
- Fully Customizable: Adapt our services to fit your specific energy needs and preferences.
- Transparent Insights: Easy-to-understand data and reports help you track your energy performance.
- Trusted by Industry Leaders: Our solutions are designed for those who prioritize sustainability and reliability.
Who Should Use This Product?
- Renewable Energy Investors: Develop comprehensive valuation models for assessing investments in Sunnova Energy (NOVA).
- Energy Sector Analysts: Evaluate market trends and valuation scenarios to inform strategic decisions.
- Consultants and Advisors: Offer clients precise valuation insights for Sunnova Energy (NOVA) and the broader renewable energy market.
- Students and Educators: Utilize real-world data to enhance learning and teaching in energy finance and modeling.
- Sustainable Energy Advocates: Gain insights into how companies like Sunnova Energy (NOVA) are valued within the green energy sector.
What the Template Contains
- Pre-Filled DCF Model: Sunnova Energy International Inc.’s (NOVA) financial data preloaded for immediate use.
- WACC Calculator: Detailed calculations for Weighted Average Cost of Capital.
- Financial Ratios: Evaluate Sunnova’s profitability, leverage, and efficiency.
- Editable Inputs: Change assumptions such as growth, margins, and CAPEX to fit your scenarios.
- Financial Statements: Annual and quarterly reports to support detailed analysis.
- Interactive Dashboard: Easily visualize key valuation metrics and results.
Disclaimer
All information, articles, and product details provided on this website are for general informational and educational purposes only. We do not claim any ownership over, nor do we intend to infringe upon, any trademarks, copyrights, logos, brand names, or other intellectual property mentioned or depicted on this site. Such intellectual property remains the property of its respective owners, and any references here are made solely for identification or informational purposes, without implying any affiliation, endorsement, or partnership.
We make no representations or warranties, express or implied, regarding the accuracy, completeness, or suitability of any content or products presented. Nothing on this website should be construed as legal, tax, investment, financial, medical, or other professional advice. In addition, no part of this site—including articles or product references—constitutes a solicitation, recommendation, endorsement, advertisement, or offer to buy or sell any securities, franchises, or other financial instruments, particularly in jurisdictions where such activity would be unlawful.
All content is of a general nature and may not address the specific circumstances of any individual or entity. It is not a substitute for professional advice or services. Any actions you take based on the information provided here are strictly at your own risk. You accept full responsibility for any decisions or outcomes arising from your use of this website and agree to release us from any liability in connection with your use of, or reliance upon, the content or products found herein.