
|
Valoración DCF de Novanta Inc. (NOVT) |
Completamente Editable: Adáptelo A Sus Necesidades En Excel O Sheets
Diseño Profesional: Plantillas Confiables Y Estándares De La Industria
Predeterminadas Para Un Uso Rápido Y Eficiente
Compatible con MAC / PC, completamente desbloqueado
No Se Necesita Experiencia; Fáciles De Seguir
Novanta Inc. (NOVT) Bundle
Diseñada para la precisión, nuestra calculadora DCF (NovT) le permite evaluar las valoraciones de Novanta Inc. utilizando datos financieros del mundo real, que le proporciona flexibilidad completa para ajustar todos los parámetros esenciales para mejorar las proyecciones.
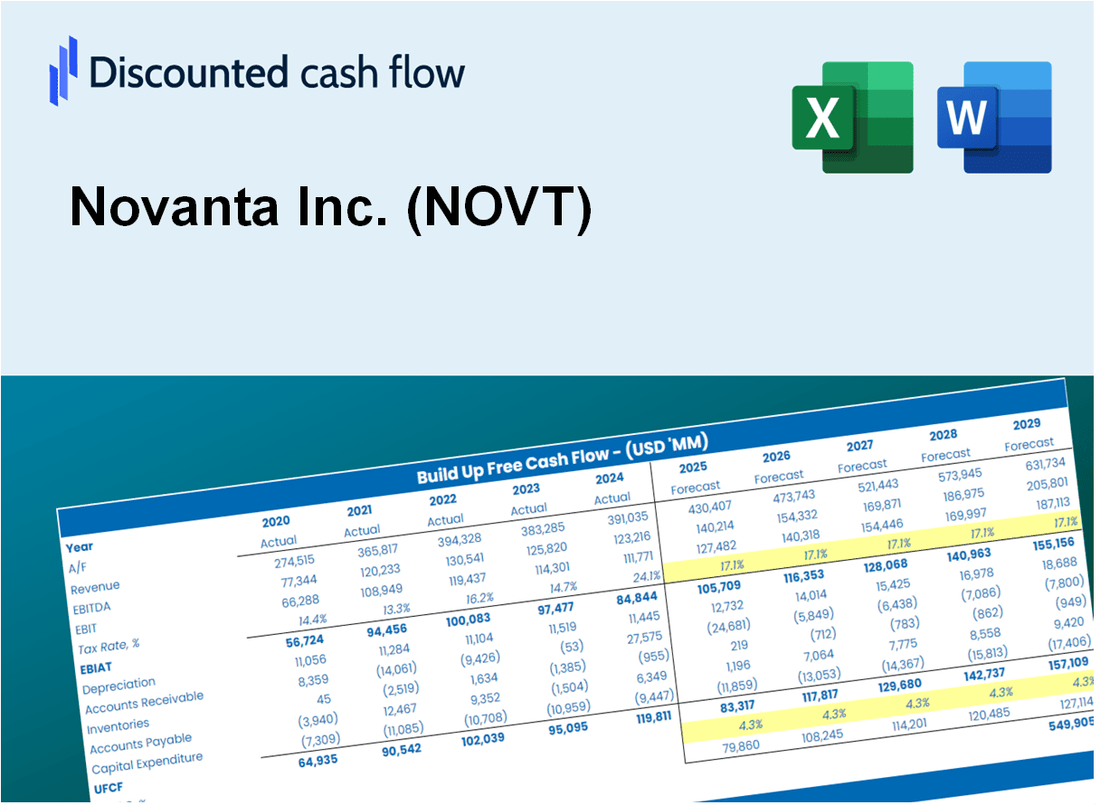
Discounted Cash Flow (DCF) - (USD MM)
| Year | AY1 2020 |
AY2 2021 |
AY3 2022 |
AY4 2023 |
AY5 2024 |
FY1 2025 |
FY2 2026 |
FY3 2027 |
FY4 2028 |
FY5 2029 |
|---|---|---|---|---|---|---|---|---|---|---|
| Revenue | 590.6 | 706.8 | 860.9 | 881.7 | 949.2 | 1,071.6 | 1,209.7 | 1,365.6 | 1,541.6 | 1,740.2 |
| Revenue Growth, % | 0 | 19.67 | 21.8 | 2.41 | 7.67 | 12.89 | 12.89 | 12.89 | 12.89 | 12.89 |
| EBITDA | 98.1 | 126.5 | 161.0 | 164.2 | 179.9 | 194.5 | 219.6 | 247.9 | 279.8 | 315.9 |
| EBITDA, % | 16.6 | 17.9 | 18.7 | 18.62 | 18.95 | 18.15 | 18.15 | 18.15 | 18.15 | 18.15 |
| Depreciation | 38.3 | 43.4 | 53.2 | 46.6 | 55.6 | 64.2 | 72.4 | 81.8 | 92.3 | 104.2 |
| Depreciation, % | 6.48 | 6.14 | 6.17 | 5.29 | 5.85 | 5.99 | 5.99 | 5.99 | 5.99 | 5.99 |
| EBIT | 59.8 | 83.1 | 107.8 | 117.5 | 124.3 | 130.4 | 147.2 | 166.1 | 187.5 | 211.7 |
| EBIT, % | 10.12 | 11.76 | 12.52 | 13.33 | 13.09 | 12.17 | 12.17 | 12.17 | 12.17 | 12.17 |
| Total Cash | 125.1 | 117.4 | 100.1 | 105.1 | 114.0 | 157.2 | 177.4 | 200.3 | 226.1 | 255.2 |
| Total Cash, percent | .0 | .0 | .0 | .0 | .0 | .0 | .0 | .0 | .0 | .0 |
| Account Receivables | 75.1 | 115.6 | 137.7 | 139.4 | 151.0 | 164.6 | 185.8 | 209.7 | 236.7 | 267.2 |
| Account Receivables, % | 12.71 | 16.36 | 15.99 | 15.81 | 15.91 | 15.36 | 15.36 | 15.36 | 15.36 | 15.36 |
| Inventories | 92.7 | 125.7 | 168.0 | 149.4 | 144.6 | 182.5 | 206.1 | 232.6 | 262.6 | 296.4 |
| Inventories, % | 15.7 | 17.78 | 19.51 | 16.94 | 15.23 | 17.03 | 17.03 | 17.03 | 17.03 | 17.03 |
| Accounts Payable | 43.0 | 68.5 | 75.2 | 57.2 | 76.9 | 86.4 | 97.5 | 110.0 | 124.2 | 140.2 |
| Accounts Payable, % | 7.27 | 9.69 | 8.74 | 6.49 | 8.1 | 8.06 | 8.06 | 8.06 | 8.06 | 8.06 |
| Capital Expenditure | -10.5 | -20.0 | -19.6 | -20.0 | -17.2 | -23.5 | -26.5 | -29.9 | -33.8 | -38.2 |
| Capital Expenditure, % | -1.78 | -2.83 | -2.28 | -2.26 | -1.81 | -2.19 | -2.19 | -2.19 | -2.19 | -2.19 |
| Tax Rate, % | 18.94 | 18.94 | 18.94 | 18.94 | 18.94 | 18.94 | 18.94 | 18.94 | 18.94 | 18.94 |
| EBITAT | 55.0 | 74.5 | 91.6 | 102.3 | 100.7 | 113.3 | 127.9 | 144.4 | 163.0 | 184.0 |
| Depreciation | ||||||||||
| Changes in Account Receivables | ||||||||||
| Changes in Inventories | ||||||||||
| Changes in Accounts Payable | ||||||||||
| Capital Expenditure | ||||||||||
| UFCF | -42.1 | 49.9 | 67.4 | 127.8 | 152.0 | 112.0 | 140.2 | 158.3 | 178.7 | 201.7 |
| WACC, % | 10.15 | 10.13 | 10.1 | 10.12 | 10.07 | 10.11 | 10.11 | 10.11 | 10.11 | 10.11 |
| PV UFCF | ||||||||||
| SUM PV UFCF | 582.1 | |||||||||
| Long Term Growth Rate, % | 4.00 | |||||||||
| Free cash flow (T + 1) | 210 | |||||||||
| Terminal Value | 3,431 | |||||||||
| Present Terminal Value | 2,119 | |||||||||
| Enterprise Value | 2,701 | |||||||||
| Net Debt | 357 | |||||||||
| Equity Value | 2,344 | |||||||||
| Diluted Shares Outstanding, MM | 36 | |||||||||
| Equity Value Per Share | 64.90 |
What You Will Get
- Real NOVT Financial Data: Pre-filled with Novanta Inc.’s historical and projected data for precise analysis.
- Fully Editable Template: Modify key inputs like revenue growth, WACC, and EBITDA % with ease.
- Automatic Calculations: See Novanta Inc.’s intrinsic value update instantly based on your changes.
- Professional Valuation Tool: Designed for investors, analysts, and consultants seeking accurate DCF results.
- User-Friendly Design: Simple structure and clear instructions for all experience levels.
Key Features
- Comprehensive NOVT Data: Pre-loaded with Novanta Inc.'s historical performance metrics and future projections.
- Flexible Input Options: Modify growth rates, profit margins, discount rates, tax implications, and capital investments.
- Adaptive Valuation Framework: Instantaneous recalculations of Net Present Value (NPV) and intrinsic value in response to your adjustments.
- Scenario Analysis: Develop various forecasting scenarios to explore diverse valuation possibilities.
- Intuitive User Interface: Clear, organized, and tailored for both industry experts and newcomers.
How It Works
- Step 1: Download the prebuilt Excel template featuring Novanta Inc.'s (NOVT) data.
- Step 2: Review the pre-filled sheets to familiarize yourself with the essential metrics.
- Step 3: Modify forecasts and assumptions in the editable yellow cells (WACC, growth, margins).
- Step 4: Instantly see recalculated results, including Novanta Inc.'s (NOVT) intrinsic value.
- Step 5: Make well-informed investment decisions or create reports based on the outputs.
Why Choose This Calculator for Novanta Inc. (NOVT)?
- Accurate Data: Utilize real Novanta financials for dependable valuation outcomes.
- Customizable: Tailor essential parameters such as growth rates, WACC, and tax rates to fit your forecasts.
- Time-Saving: Pre-configured calculations streamline your analysis process.
- Professional-Grade Tool: Crafted for investors, analysts, and consultants in the field.
- User-Friendly: Easy-to-navigate design and detailed instructions ensure accessibility for all users.
Who Should Use This Product?
- Individual Investors: Make informed decisions about buying or selling Novanta Inc. (NOVT) stock.
- Financial Analysts: Streamline valuation processes with ready-to-use financial models specific to Novanta Inc. (NOVT).
- Consultants: Deliver professional valuation insights on Novanta Inc. (NOVT) to clients quickly and accurately.
- Business Owners: Understand how companies like Novanta Inc. (NOVT) are valued to guide your own strategy.
- Finance Students: Learn valuation techniques using real-world data and scenarios related to Novanta Inc. (NOVT).
What the Template Contains
- Pre-Filled Data: Includes Novanta Inc.'s (NOVT) historical financials and forecasts.
- Discounted Cash Flow Model: Editable DCF valuation model with automatic calculations.
- Weighted Average Cost of Capital (WACC): A dedicated sheet for calculating WACC based on custom inputs.
- Key Financial Ratios: Analyze Novanta Inc.'s (NOVT) profitability, efficiency, and leverage.
- Customizable Inputs: Edit revenue growth, margins, and tax rates with ease.
- Clear Dashboard: Charts and tables summarizing key valuation results.
Disclaimer
All information, articles, and product details provided on this website are for general informational and educational purposes only. We do not claim any ownership over, nor do we intend to infringe upon, any trademarks, copyrights, logos, brand names, or other intellectual property mentioned or depicted on this site. Such intellectual property remains the property of its respective owners, and any references here are made solely for identification or informational purposes, without implying any affiliation, endorsement, or partnership.
We make no representations or warranties, express or implied, regarding the accuracy, completeness, or suitability of any content or products presented. Nothing on this website should be construed as legal, tax, investment, financial, medical, or other professional advice. In addition, no part of this site—including articles or product references—constitutes a solicitation, recommendation, endorsement, advertisement, or offer to buy or sell any securities, franchises, or other financial instruments, particularly in jurisdictions where such activity would be unlawful.
All content is of a general nature and may not address the specific circumstances of any individual or entity. It is not a substitute for professional advice or services. Any actions you take based on the information provided here are strictly at your own risk. You accept full responsibility for any decisions or outcomes arising from your use of this website and agree to release us from any liability in connection with your use of, or reliance upon, the content or products found herein.