
|
Neurones S.A. (NRO.PA) Valoración de DCF |
Completamente Editable: Adáptelo A Sus Necesidades En Excel O Sheets
Diseño Profesional: Plantillas Confiables Y Estándares De La Industria
Predeterminadas Para Un Uso Rápido Y Eficiente
Compatible con MAC / PC, completamente desbloqueado
No Se Necesita Experiencia; Fáciles De Seguir
Neurones S.A. (NRO.PA) Bundle
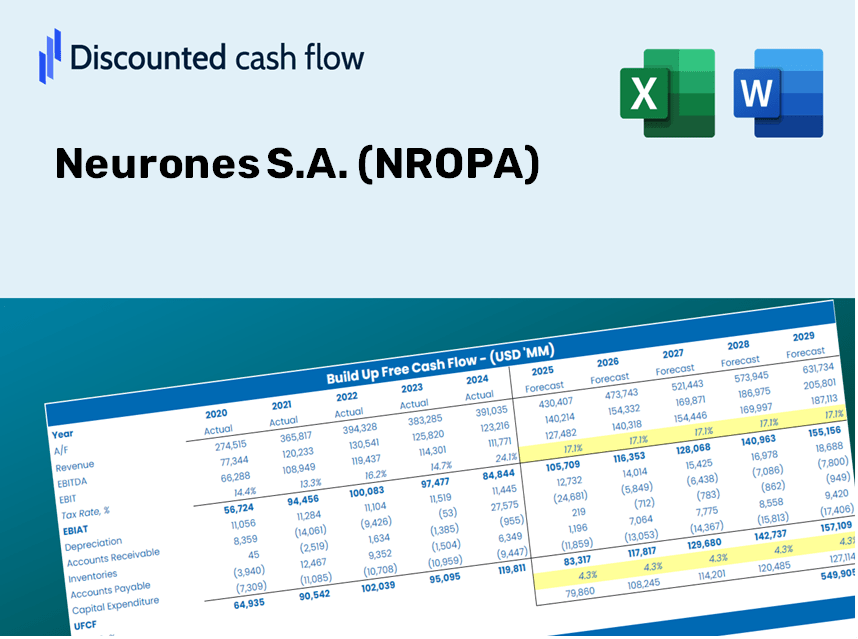
¡Simplifique la valoración de las neuronas S.A. (NROPA) con esta calculadora DCF personalizable! Con Neurones reales S.A. (NROPA) Financials y entradas de pronóstico ajustables, puede probar escenarios y descubrir el valor razonable de las Neurones S.A. (NROPA) en minutos.
Discounted Cash Flow (DCF) - (USD MM)
| Year | AY1 2020 |
AY2 2021 |
AY3 2022 |
AY4 2023 |
AY5 2024 |
FY1 2025 |
FY2 2026 |
FY3 2027 |
FY4 2028 |
FY5 2029 |
|---|---|---|---|---|---|---|---|---|---|---|
| Revenue | 524.5 | 579.9 | 665.4 | 741.2 | 810.4 | 903.7 | 1,007.7 | 1,123.6 | 1,253.0 | 1,397.2 |
| Revenue Growth, % | 0 | 10.56 | 14.74 | 11.39 | 9.34 | 11.51 | 11.51 | 11.51 | 11.51 | 11.51 |
| EBITDA | 68.8 | 76.2 | 88.7 | 96.6 | 85.9 | 114.3 | 127.4 | 142.1 | 158.5 | 176.7 |
| EBITDA, % | 13.11 | 13.15 | 13.33 | 13.04 | 10.6 | 12.65 | 12.65 | 12.65 | 12.65 | 12.65 |
| Depreciation | 15.0 | 14.8 | 15.4 | 15.9 | 8.0 | 19.6 | 21.9 | 24.4 | 27.2 | 30.4 |
| Depreciation, % | 2.87 | 2.55 | 2.32 | 2.15 | 0.99013 | 2.17 | 2.17 | 2.17 | 2.17 | 2.17 |
| EBIT | 53.8 | 61.4 | 73.3 | 80.7 | 77.9 | 94.6 | 105.5 | 117.7 | 131.2 | 146.3 |
| EBIT, % | 10.25 | 10.59 | 11.02 | 10.89 | 9.61 | 10.47 | 10.47 | 10.47 | 10.47 | 10.47 |
| Total Cash | 266.6 | 265.2 | 272.1 | 297.8 | 326.5 | 393.8 | 439.2 | 489.7 | 546.1 | 608.9 |
| Total Cash, percent | .0 | .0 | .0 | .0 | .0 | .0 | .0 | .0 | .0 | .0 |
| Account Receivables | 174.4 | 165.7 | 192.2 | 207.5 | 216.8 | 262.9 | 293.1 | 326.9 | 364.5 | 406.5 |
| Account Receivables, % | 33.24 | 28.57 | 28.89 | 28 | 26.75 | 29.09 | 29.09 | 29.09 | 29.09 | 29.09 |
| Inventories | 1.3 | .9 | .4 | .7 | .3 | 1.1 | 1.2 | 1.3 | 1.5 | 1.6 |
| Inventories, % | 0.24919 | 0.15296 | 0.05305247 | 0.09565892 | 0.03294669 | 0.11676 | 0.11676 | 0.11676 | 0.11676 | 0.11676 |
| Accounts Payable | 32.7 | 37.7 | 42.9 | 44.0 | 58.3 | 58.4 | 65.1 | 72.6 | 81.0 | 90.3 |
| Accounts Payable, % | 6.23 | 6.51 | 6.45 | 5.94 | 7.2 | 6.46 | 6.46 | 6.46 | 6.46 | 6.46 |
| Capital Expenditure | -7.2 | -6.6 | -10.6 | -18.0 | -12.0 | -14.5 | -16.1 | -18.0 | -20.1 | -22.4 |
| Capital Expenditure, % | -1.37 | -1.13 | -1.59 | -2.43 | -1.49 | -1.6 | -1.6 | -1.6 | -1.6 | -1.6 |
| Tax Rate, % | 40.41 | 40.41 | 40.41 | 40.41 | 40.41 | 40.41 | 40.41 | 40.41 | 40.41 | 40.41 |
| EBITAT | 31.0 | 37.5 | 44.5 | 49.4 | 46.4 | 56.8 | 63.4 | 70.7 | 78.8 | 87.9 |
| Depreciation | ||||||||||
| Changes in Account Receivables | ||||||||||
| Changes in Inventories | ||||||||||
| Changes in Accounts Payable | ||||||||||
| Capital Expenditure | ||||||||||
| UFCF | -104.1 | 59.9 | 28.5 | 32.8 | 47.9 | 15.2 | 45.5 | 50.7 | 56.6 | 63.1 |
| WACC, % | 6.01 | 6.02 | 6.02 | 6.02 | 6.02 | 6.02 | 6.02 | 6.02 | 6.02 | 6.02 |
| PV UFCF | ||||||||||
| SUM PV UFCF | 189.2 | |||||||||
| Long Term Growth Rate, % | 2.00 | |||||||||
| Free cash flow (T + 1) | 64 | |||||||||
| Terminal Value | 1,601 | |||||||||
| Present Terminal Value | 1,195 | |||||||||
| Enterprise Value | 1,385 | |||||||||
| Net Debt | -284 | |||||||||
| Equity Value | 1,669 | |||||||||
| Diluted Shares Outstanding, MM | 24 | |||||||||
| Equity Value Per Share | 68.55 |
What You Will Receive
- Real Neurones Data: Preloaded financial information – from revenue to EBIT – derived from actual and projected numbers.
- Complete Customization: Modify all essential parameters (yellow cells) such as WACC, growth %, and tax rates.
- Immediate Valuation Updates: Automatic recalculations to evaluate the effect of changes on Neurones' fair value.
- Flexible Excel Template: Designed for quick adjustments, scenario analysis, and thorough forecasts.
- Efficient and Precise: Eliminate the need to build models from the ground up while ensuring accuracy and adaptability.
Key Features
- Authentic Neurones Financial Data: Gain access to precise pre-loaded historical performance metrics and future forecasts.
- Adjustable Forecast Parameters: Modify editable yellow-highlighted cells for WACC, growth rates, and profit margins.
- Real-Time Calculations: Automatic updates for DCF, Net Present Value (NPV), and cash flow assessments.
- User-Friendly Dashboard: Clear charts and summaries to help visualize your valuation outcomes.
- Designed for All Levels: An intuitive layout catering to investors, CFOs, and consultants, whether seasoned or new.
How It Works
- 1. Access the Template: Download and open the Excel file featuring Neurones S.A. (NROPA) preloaded data.
- 2. Modify Assumptions: Adjust critical inputs such as growth projections, WACC, and capital investments.
- 3. Obtain Instant Results: The DCF model automatically calculates intrinsic value and NPV in real-time.
- 4. Explore Scenarios: Analyze various forecasts to evaluate different valuation scenarios.
- 5. Present with Confidence: Deliver expert valuation insights to inform your decision-making process.
Why Choose the Neurones S.A. (NROPA) Calculator?
- User-Friendly Interface: Tailored for both novices and seasoned professionals.
- Customizable Inputs: Easily adjust parameters to suit your financial analysis.
- Real-Time Updates: Witness immediate changes in Neurones S.A.’s valuation as you modify your inputs.
- Preloaded Data: Comes equipped with actual financial information for Neurones S.A. for rapid assessments.
- Preferred by Industry Experts: Valued by investors and analysts for making educated financial choices.
Who Can Benefit from This Product?
- Investors: Precisely assess Neurones S.A.'s fair value (NROPA) prior to making investment choices.
- CFOs: Utilize a high-caliber DCF model for comprehensive financial reporting and analysis.
- Consultants: Swiftly modify the template for client valuation reports.
- Entrepreneurs: Acquire knowledge on financial modeling practices employed by leading companies.
- Educators: Employ it as a resource to illustrate valuation techniques.
Contents of the Template
- Pre-Filled DCF Model: Neurones S.A. (NROPA) financial data preloaded for immediate application.
- WACC Calculator: Comprehensive calculations for Weighted Average Cost of Capital.
- Financial Ratios: Assess Neurones S.A. (NROPA)'s profitability, leverage, and operational efficiency.
- Editable Inputs: Adjust assumptions such as growth rates, margins, and capital expenditures to tailor your analysis.
- Financial Statements: Access annual and quarterly reports to facilitate in-depth examination.
- Interactive Dashboard: Effortlessly visualize essential valuation metrics and outcomes.
Disclaimer
All information, articles, and product details provided on this website are for general informational and educational purposes only. We do not claim any ownership over, nor do we intend to infringe upon, any trademarks, copyrights, logos, brand names, or other intellectual property mentioned or depicted on this site. Such intellectual property remains the property of its respective owners, and any references here are made solely for identification or informational purposes, without implying any affiliation, endorsement, or partnership.
We make no representations or warranties, express or implied, regarding the accuracy, completeness, or suitability of any content or products presented. Nothing on this website should be construed as legal, tax, investment, financial, medical, or other professional advice. In addition, no part of this site—including articles or product references—constitutes a solicitation, recommendation, endorsement, advertisement, or offer to buy or sell any securities, franchises, or other financial instruments, particularly in jurisdictions where such activity would be unlawful.
All content is of a general nature and may not address the specific circumstances of any individual or entity. It is not a substitute for professional advice or services. Any actions you take based on the information provided here are strictly at your own risk. You accept full responsibility for any decisions or outcomes arising from your use of this website and agree to release us from any liability in connection with your use of, or reliance upon, the content or products found herein.