
|
Valoración DCF de NETGEAR, Inc. (NTGR) |
Completamente Editable: Adáptelo A Sus Necesidades En Excel O Sheets
Diseño Profesional: Plantillas Confiables Y Estándares De La Industria
Predeterminadas Para Un Uso Rápido Y Eficiente
Compatible con MAC / PC, completamente desbloqueado
No Se Necesita Experiencia; Fáciles De Seguir
NETGEAR, Inc. (NTGR) Bundle
¡Simplifique la valoración de NetGear, Inc. (NTGR) con esta calculadora DCF personalizable! Con Real Netgear, Inc. (NTGR) financieras y entradas de pronóstico ajustables, puede probar escenarios y descubrir el valor razonable de Netgear, Inc. (NTGR) en minutos.
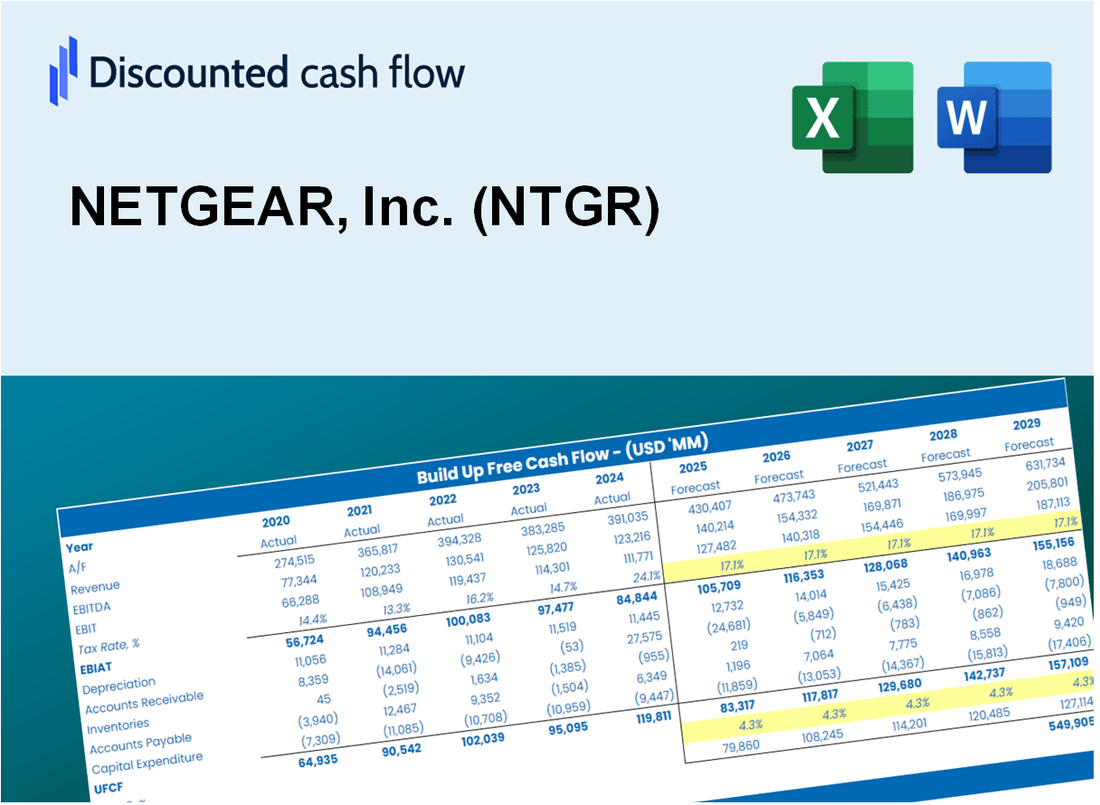
Discounted Cash Flow (DCF) - (USD MM)
| Year | AY1 2020 |
AY2 2021 |
AY3 2022 |
AY4 2023 |
AY5 2024 |
FY1 2025 |
FY2 2026 |
FY3 2027 |
FY4 2028 |
FY5 2029 |
|---|---|---|---|---|---|---|---|---|---|---|
| Revenue | 1,255.2 | 1,168.1 | 932.5 | 740.8 | 673.8 | 578.2 | 496.2 | 425.9 | 365.5 | 313.7 |
| Revenue Growth, % | 0 | -6.94 | -20.17 | -20.55 | -9.05 | -14.18 | -14.18 | -14.18 | -14.18 | -14.18 |
| EBITDA | 94.5 | 80.5 | -23.8 | -25.0 | -65.8 | -1.5 | -1.3 | -1.1 | -.9 | -.8 |
| EBITDA, % | 7.53 | 6.89 | -2.55 | -3.38 | -9.77 | -0.25645 | -0.25645 | -0.25645 | -0.25645 | -0.25645 |
| Depreciation | 18.9 | 13.9 | 10.1 | 7.2 | 6.5 | 6.6 | 5.7 | 4.9 | 4.2 | 3.6 |
| Depreciation, % | 1.51 | 1.19 | 1.08 | 0.96661 | 0.96681 | 1.14 | 1.14 | 1.14 | 1.14 | 1.14 |
| EBIT | 75.5 | 66.6 | -33.9 | -32.2 | -72.3 | -8.1 | -6.9 | -6.0 | -5.1 | -4.4 |
| EBIT, % | 6.02 | 5.7 | -3.63 | -4.35 | -10.73 | -1.4 | -1.4 | -1.4 | -1.4 | -1.4 |
| Total Cash | 353.3 | 271.5 | 227.4 | 283.6 | 408.7 | 202.1 | 173.4 | 148.8 | 127.7 | 109.6 |
| Total Cash, percent | .0 | .0 | .0 | .0 | .0 | .0 | .0 | .0 | .0 | .0 |
| Account Receivables | 337.1 | 261.2 | 277.5 | 185.1 | 156.2 | 147.0 | 126.2 | 108.3 | 92.9 | 79.8 |
| Account Receivables, % | 26.85 | 22.36 | 29.76 | 24.98 | 23.18 | 25.43 | 25.43 | 25.43 | 25.43 | 25.43 |
| Inventories | 172.1 | 315.7 | 299.6 | 248.9 | 162.5 | 151.0 | 129.6 | 111.2 | 95.5 | 81.9 |
| Inventories, % | 13.71 | 27.02 | 32.13 | 33.59 | 24.12 | 26.12 | 26.12 | 26.12 | 26.12 | 26.12 |
| Accounts Payable | 90.9 | 73.7 | 85.6 | 46.9 | 58.5 | 43.6 | 37.4 | 32.1 | 27.6 | 23.7 |
| Accounts Payable, % | 7.24 | 6.31 | 9.17 | 6.32 | 8.68 | 7.55 | 7.55 | 7.55 | 7.55 | 7.55 |
| Capital Expenditure | -10.3 | -9.9 | -5.8 | -5.8 | -9.0 | -5.1 | -4.4 | -3.7 | -3.2 | -2.8 |
| Capital Expenditure, % | -0.82027 | -0.84447 | -0.61739 | -0.78276 | -1.33 | -0.87996 | -0.87996 | -0.87996 | -0.87996 | -0.87996 |
| Tax Rate, % | 50.33 | 50.33 | 50.33 | 50.33 | 50.33 | 50.33 | 50.33 | 50.33 | 50.33 | 50.33 |
| EBITAT | 62.2 | 50.2 | -28.5 | -176.3 | -35.9 | -6.3 | -5.4 | -4.7 | -4.0 | -3.4 |
| Depreciation | ||||||||||
| Changes in Account Receivables | ||||||||||
| Changes in Inventories | ||||||||||
| Changes in Accounts Payable | ||||||||||
| Capital Expenditure | ||||||||||
| UFCF | -347.4 | -30.6 | -12.6 | -70.5 | 88.4 | 1.1 | 31.9 | 27.4 | 23.5 | 20.2 |
| WACC, % | 8.69 | 8.68 | 8.69 | 8.71 | 8.66 | 8.69 | 8.69 | 8.69 | 8.69 | 8.69 |
| PV UFCF | ||||||||||
| SUM PV UFCF | 79.5 | |||||||||
| Long Term Growth Rate, % | 4.00 | |||||||||
| Free cash flow (T + 1) | 21 | |||||||||
| Terminal Value | 448 | |||||||||
| Present Terminal Value | 295 | |||||||||
| Enterprise Value | 375 | |||||||||
| Net Debt | -256 | |||||||||
| Equity Value | 631 | |||||||||
| Diluted Shares Outstanding, MM | 30 | |||||||||
| Equity Value Per Share | 21.25 |
What You Will Get
- Real NETGEAR Data: Preloaded financials – from revenue to EBIT – based on actual and projected figures.
- Full Customization: Adjust all critical parameters (yellow cells) like WACC, growth %, and tax rates.
- Instant Valuation Updates: Automatic recalculations to analyze the impact of changes on NETGEAR’s fair value.
- Versatile Excel Template: Tailored for quick edits, scenario testing, and detailed projections.
- Time-Saving and Accurate: Skip building models from scratch while maintaining precision and flexibility.
Key Features
- Customizable Network Settings: Adjust essential parameters such as bandwidth allocation, security protocols, and device prioritization.
- Real-Time Performance Monitoring: Provides instant feedback on network performance, latency, and connectivity issues.
- Enterprise-Level Reliability: Leverages NETGEAR's proven technology to ensure consistent and dependable network solutions.
- Flexible Configuration Options: Easily test various network setups and analyze their impact on performance.
- Efficiency-Boosting Solution: Streamlines network management, reducing the time spent on manual configurations.
How It Works
- Step 1: Download the Excel file.
- Step 2: Review NETGEAR, Inc.'s (NTGR) pre-filled financial data and forecasts.
- Step 3: Modify key inputs such as revenue growth, WACC, and tax rates (highlighted cells).
- Step 4: Observe the DCF model update in real-time as you adjust your assumptions.
- Step 5: Analyze the outputs and leverage the findings for your investment decisions.
Why Choose This Calculator for NETGEAR, Inc. (NTGR)?
- Accurate Data: Real NETGEAR financials ensure reliable valuation results.
- Customizable: Adjust key parameters like growth rates, WACC, and tax rates to align with your forecasts.
- Time-Saving: Pre-built calculations save you from starting from scratch.
- Professional-Grade Tool: Tailored for investors, analysts, and consultants in the tech sector.
- User-Friendly: Intuitive interface and step-by-step guidance make it accessible for all users.
Who Should Use NETGEAR, Inc. (NTGR)?
- IT Students: Explore networking concepts and apply them using real-world scenarios.
- Researchers: Integrate advanced networking models into studies or academic projects.
- Home Users: Assess your networking needs and discover solutions offered by NETGEAR.
- Network Engineers: Enhance your projects with customizable configurations from NETGEAR products.
- Small Business Owners: Understand how to optimize network performance for your business operations.
What the Template Contains
- Preloaded NTGR Data: Historical and projected financial data, including revenue, EBIT, and capital expenditures.
- DCF and WACC Models: Professional-grade sheets for calculating intrinsic value and Weighted Average Cost of Capital.
- Editable Inputs: Yellow-highlighted cells for adjusting revenue growth, tax rates, and discount rates.
- Financial Statements: Comprehensive annual and quarterly financials for deeper analysis.
- Key Ratios: Profitability, leverage, and efficiency ratios to evaluate performance.
- Dashboard and Charts: Visual summaries of valuation outcomes and assumptions.
Disclaimer
All information, articles, and product details provided on this website are for general informational and educational purposes only. We do not claim any ownership over, nor do we intend to infringe upon, any trademarks, copyrights, logos, brand names, or other intellectual property mentioned or depicted on this site. Such intellectual property remains the property of its respective owners, and any references here are made solely for identification or informational purposes, without implying any affiliation, endorsement, or partnership.
We make no representations or warranties, express or implied, regarding the accuracy, completeness, or suitability of any content or products presented. Nothing on this website should be construed as legal, tax, investment, financial, medical, or other professional advice. In addition, no part of this site—including articles or product references—constitutes a solicitation, recommendation, endorsement, advertisement, or offer to buy or sell any securities, franchises, or other financial instruments, particularly in jurisdictions where such activity would be unlawful.
All content is of a general nature and may not address the specific circumstances of any individual or entity. It is not a substitute for professional advice or services. Any actions you take based on the information provided here are strictly at your own risk. You accept full responsibility for any decisions or outcomes arising from your use of this website and agree to release us from any liability in connection with your use of, or reliance upon, the content or products found herein.