
|
Valoración de DCF NTPC Limited (NTPC.NS) |
Completamente Editable: Adáptelo A Sus Necesidades En Excel O Sheets
Diseño Profesional: Plantillas Confiables Y Estándares De La Industria
Predeterminadas Para Un Uso Rápido Y Eficiente
Compatible con MAC / PC, completamente desbloqueado
No Se Necesita Experiencia; Fáciles De Seguir
NTPC Limited (NTPC.NS) Bundle
¡Agilice su análisis y mejore la precisión con nuestra calculadora DCF (NTPCNS)! Utilizando datos reales de las entradas NTPC Limited y personalizables, esta herramienta le permite pronosticar, analizar y valorar NTPC como un inversor experimentado.
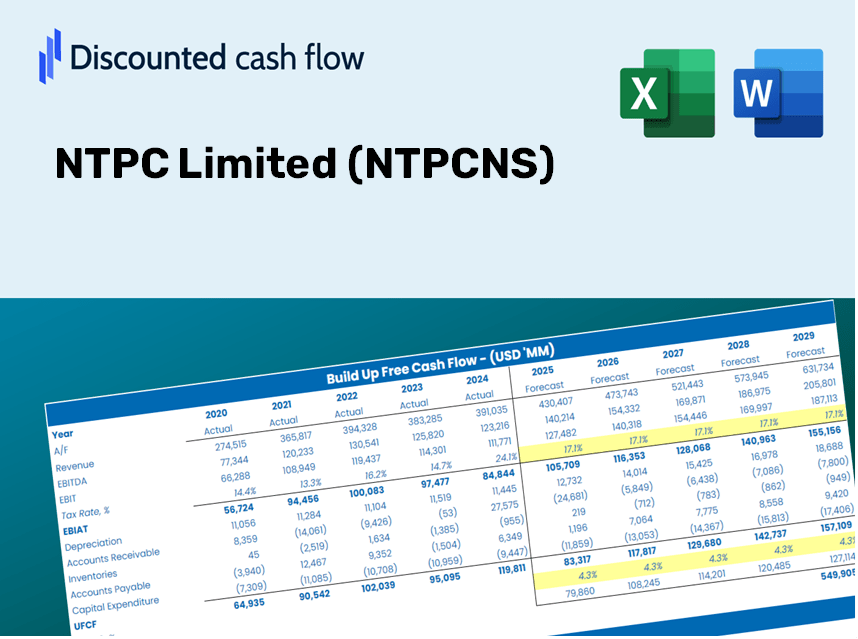
Discounted Cash Flow (DCF) - (USD MM)
| Year | AY1 2021 |
AY2 2022 |
AY3 2023 |
AY4 2024 |
AY5 2025 |
FY1 2026 |
FY2 2027 |
FY3 2028 |
FY4 2029 |
FY5 2030 |
|---|---|---|---|---|---|---|---|---|---|---|
| Revenue | 1,115,311.5 | 1,326,692.8 | 1,762,071.8 | 1,785,248.0 | 1,881,380.6 | 2,156,389.8 | 2,471,598.1 | 2,832,881.8 | 3,246,975.8 | 3,721,599.7 |
| Revenue Growth, % | 0 | 18.95 | 32.82 | 1.32 | 5.38 | 14.62 | 14.62 | 14.62 | 14.62 | 14.62 |
| EBITDA | 340,303.8 | 397,017.9 | 487,851.3 | 501,235.6 | 546,540.8 | 626,431.8 | 717,999.9 | 822,952.9 | 943,247.3 | 1,081,125.6 |
| EBITDA, % | 30.51 | 29.93 | 27.69 | 28.08 | 29.05 | 29.05 | 29.05 | 29.05 | 29.05 | 29.05 |
| Depreciation | 120,482.1 | 132,849.7 | 144,085.3 | 157,875.0 | 169,682.0 | 202,077.5 | 231,616.0 | 265,472.3 | 304,277.4 | 348,754.9 |
| Depreciation, % | 10.8 | 10.01 | 8.18 | 8.84 | 9.02 | 9.37 | 9.37 | 9.37 | 9.37 | 9.37 |
| EBIT | 219,821.7 | 264,168.2 | 343,766.0 | 343,360.6 | 376,858.8 | 424,354.3 | 486,383.9 | 557,480.6 | 638,969.8 | 732,370.7 |
| EBIT, % | 19.71 | 19.91 | 19.51 | 19.23 | 20.03 | 19.68 | 19.68 | 19.68 | 19.68 | 19.68 |
| Total Cash | 35,645.3 | 25,502.5 | 22,071.8 | 39,165.5 | 45,082.6 | 47,272.2 | 54,182.1 | 62,102.2 | 71,179.9 | 81,584.6 |
| Total Cash, percent | .0 | .0 | .0 | .0 | .0 | .0 | .0 | .0 | .0 | .0 |
| Account Receivables | 357,804.5 | 373,497.5 | 423,605.1 | 492,723.7 | 350,181.6 | 562,759.8 | 645,020.7 | 739,306.1 | 847,373.5 | 971,237.5 |
| Account Receivables, % | 32.08 | 28.15 | 24.04 | 27.6 | 18.61 | 26.1 | 26.1 | 26.1 | 26.1 | 26.1 |
| Inventories | 98,096.0 | 101,392.9 | 142,403.7 | 180,191.2 | 187,222.6 | 192,195.6 | 220,289.6 | 252,490.3 | 289,397.8 | 331,700.3 |
| Inventories, % | 8.8 | 7.64 | 8.08 | 10.09 | 9.95 | 8.91 | 8.91 | 8.91 | 8.91 | 8.91 |
| Accounts Payable | 87,262.8 | 112,773.2 | 113,561.6 | 113,379.5 | 111,599.6 | 151,171.0 | 173,268.3 | 198,595.7 | 227,625.2 | 260,898.1 |
| Accounts Payable, % | 7.82 | 8.5 | 6.44 | 6.35 | 5.93 | 7.01 | 7.01 | 7.01 | 7.01 | 7.01 |
| Capital Expenditure | -233,123.4 | -244,444.2 | -248,185.2 | -308,159.2 | -412,833.6 | -399,434.8 | -457,821.8 | -524,743.5 | -601,447.5 | -689,363.5 |
| Capital Expenditure, % | -20.9 | -18.43 | -14.08 | -17.26 | -21.94 | -18.52 | -18.52 | -18.52 | -18.52 | -18.52 |
| Tax Rate, % | 27.26 | 27.26 | 27.26 | 27.26 | 27.26 | 27.26 | 27.26 | 27.26 | 27.26 | 27.26 |
| EBITAT | 184,992.7 | 200,171.1 | 243,084.2 | 253,929.1 | 274,143.4 | 320,252.0 | 367,064.5 | 420,719.9 | 482,218.2 | 552,706.0 |
| Depreciation | ||||||||||
| Changes in Account Receivables | ||||||||||
| Changes in Inventories | ||||||||||
| Changes in Accounts Payable | ||||||||||
| Capital Expenditure | ||||||||||
| UFCF | -296,286.3 | 95,097.1 | 48,654.3 | -3,443.3 | 164,722.6 | -55,085.1 | 52,601.0 | 60,289.9 | 69,102.8 | 79,203.8 |
| WACC, % | 4.6 | 4.42 | 4.32 | 4.39 | 4.36 | 4.42 | 4.42 | 4.42 | 4.42 | 4.42 |
| PV UFCF | ||||||||||
| SUM PV UFCF | 170,382.3 | |||||||||
| Long Term Growth Rate, % | 3.00 | |||||||||
| Free cash flow (T + 1) | 81,580 | |||||||||
| Terminal Value | 5,753,143 | |||||||||
| Present Terminal Value | 4,634,770 | |||||||||
| Enterprise Value | 4,805,152 | |||||||||
| Net Debt | 2,386,391 | |||||||||
| Equity Value | 2,418,762 | |||||||||
| Diluted Shares Outstanding, MM | 9,695 | |||||||||
| Equity Value Per Share | 249.49 |
Benefits You Will Receive
- Adjustable Forecast Assumptions: Conveniently modify parameters (growth %, margins, WACC) to explore various scenarios.
- Comprehensive Data: NTPC Limited's (NTPCNS) financial information pre-loaded to kickstart your analysis.
- Instant DCF Calculations: The model automatically computes Net Present Value (NPV) and intrinsic value for you.
- Tailorable and Professional: A refined Excel model that fits your specific valuation requirements.
- Designed for Analysts and Investors: Perfect for evaluating projections, confirming strategies, and enhancing efficiency.
Key Features
- Real-Life NTPC Data: Comes pre-loaded with NTPC Limited's historical financial data and future projections.
- Fully Customizable Inputs: Modify parameters such as revenue growth, profit margins, cost of capital, tax rates, and capital expenditures.
- Dynamic Valuation Model: Automatically recalculates Net Present Value (NPV) and intrinsic value based on your adjustments.
- Scenario Testing: Develop various forecast scenarios to evaluate different valuation results.
- User-Friendly Interface: Intuitive and organized design suitable for both professionals and newcomers.
How It Functions
- Download: Obtain the pre-configured Excel file containing NTPC Limited’s (NTPCNS) financial data.
- Customize: Modify projections, such as revenue growth, EBITDA percentage, and WACC.
- Update Instantly: The intrinsic value and NPV calculations refresh in real-time.
- Explore Scenarios: Generate various forecasts and assess the results immediately.
- Make Informed Choices: Utilize the valuation insights to shape your investment approach.
Why Opt for This Calculator?
- Precision: Utilizes authentic NTPC Limited financial data for reliable results.
- Adaptability: Crafted to allow users to effortlessly test and adjust inputs.
- Efficiency: Bypass the complexities of creating a DCF model from the ground up.
- Expert-Level: Designed with the detailed accuracy and functionality expected by CFOs.
- Intuitive: Simple to navigate, even for those lacking extensive financial modeling expertise.
Who Can Benefit from This Product?
- Finance Students: Master valuation methods and practice with real-time data from NTPC Limited (NTPCNS).
- Academics: Integrate advanced financial models into your studies or research projects.
- Investors: Evaluate your investment strategies and analyze valuation results for NTPC Limited (NTPCNS).
- Analysts: Enhance your efficiency with a customizable DCF model designed for NTPC Limited (NTPCNS).
- Small Business Owners: Discover how major public corporations like NTPC Limited (NTPCNS) are assessed by analysts.
Contents of the Template
- Operating and Balance Sheet Data: Pre-filled historical data and forecasts for NTPC Limited (NTPCNS), including revenue, EBITDA, EBIT, and capital expenditures.
- WACC Calculation: A dedicated sheet for calculating Weighted Average Cost of Capital (WACC), featuring parameters such as Beta, risk-free rate, and share price.
- DCF Valuation (Unlevered and Levered): Customizable Discounted Cash Flow models that display intrinsic value along with detailed calculations.
- Financial Statements: Pre-loaded annual and quarterly financial statements to aid in analysis.
- Key Ratios: Provides key profitability, leverage, and efficiency ratios for NTPC Limited (NTPCNS).
- Dashboard and Charts: A visual summary of valuation outputs and assumptions, facilitating straightforward analysis of results.
Disclaimer
All information, articles, and product details provided on this website are for general informational and educational purposes only. We do not claim any ownership over, nor do we intend to infringe upon, any trademarks, copyrights, logos, brand names, or other intellectual property mentioned or depicted on this site. Such intellectual property remains the property of its respective owners, and any references here are made solely for identification or informational purposes, without implying any affiliation, endorsement, or partnership.
We make no representations or warranties, express or implied, regarding the accuracy, completeness, or suitability of any content or products presented. Nothing on this website should be construed as legal, tax, investment, financial, medical, or other professional advice. In addition, no part of this site—including articles or product references—constitutes a solicitation, recommendation, endorsement, advertisement, or offer to buy or sell any securities, franchises, or other financial instruments, particularly in jurisdictions where such activity would be unlawful.
All content is of a general nature and may not address the specific circumstances of any individual or entity. It is not a substitute for professional advice or services. Any actions you take based on the information provided here are strictly at your own risk. You accept full responsibility for any decisions or outcomes arising from your use of this website and agree to release us from any liability in connection with your use of, or reliance upon, the content or products found herein.