
|
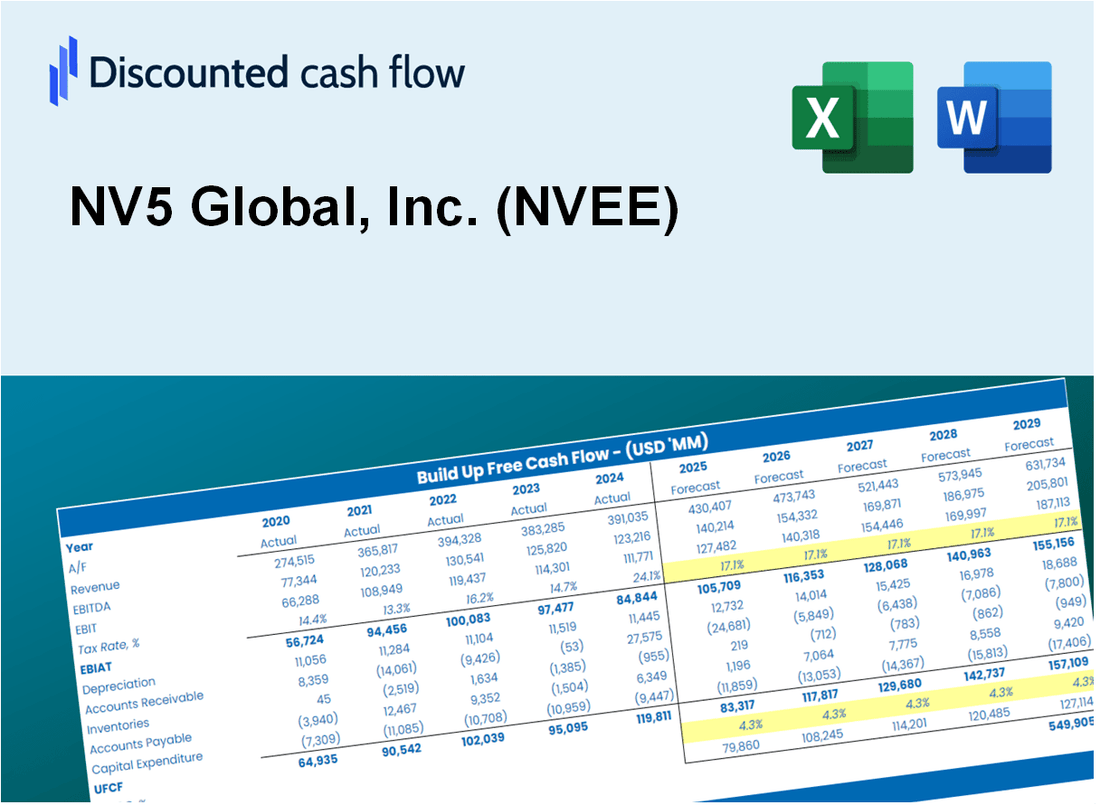
Valoración DCF de NV5 Global, Inc. (NVEE) |
Completamente Editable: Adáptelo A Sus Necesidades En Excel O Sheets
Diseño Profesional: Plantillas Confiables Y Estándares De La Industria
Predeterminadas Para Un Uso Rápido Y Eficiente
Compatible con MAC / PC, completamente desbloqueado
No Se Necesita Experiencia; Fáciles De Seguir
NV5 Global, Inc. (NVEE) Bundle
Como inversor o analista, la calculadora DCF de NV5 Global, Inc. (NVEE) es su recurso de referencia para una valoración precisa. Cargado con datos reales de NV5 Global, puede ajustar fácilmente los pronósticos y observar instantáneamente los efectos.
Discounted Cash Flow (DCF) - (USD MM)
| Year | AY1 2020 |
AY2 2021 |
AY3 2022 |
AY4 2023 |
AY5 2024 |
FY1 2025 |
FY2 2026 |
FY3 2027 |
FY4 2028 |
FY5 2029 |
|---|---|---|---|---|---|---|---|---|---|---|
| Revenue | 659.3 | 706.7 | 786.8 | 861.7 | 941.3 | 1,029.0 | 1,124.9 | 1,229.7 | 1,344.3 | 1,469.6 |
| Revenue Growth, % | 0 | 7.19 | 11.33 | 9.53 | 9.23 | 9.32 | 9.32 | 9.32 | 9.32 | 9.32 |
| EBITDA | 99.1 | 123.5 | 123.1 | 119.2 | 110.0 | 151.6 | 165.7 | 181.2 | 198.1 | 216.5 |
| EBITDA, % | 15.03 | 17.48 | 15.64 | 13.83 | 11.69 | 14.73 | 14.73 | 14.73 | 14.73 | 14.73 |
| Depreciation | 55.0 | 55.2 | 56.9 | 58.0 | 66.6 | 76.5 | 83.6 | 91.4 | 100.0 | 109.3 |
| Depreciation, % | 8.34 | 7.81 | 7.23 | 6.73 | 7.08 | 7.44 | 7.44 | 7.44 | 7.44 | 7.44 |
| EBIT | 44.1 | 68.3 | 66.2 | 61.2 | 43.4 | 75.1 | 82.1 | 89.8 | 98.1 | 107.3 |
| EBIT, % | 6.7 | 9.67 | 8.41 | 7.1 | 4.61 | 7.3 | 7.3 | 7.3 | 7.3 | 7.3 |
| Total Cash | 64.9 | 48.0 | 38.5 | 44.8 | 50.4 | 66.0 | 72.2 | 78.9 | 86.3 | 94.3 |
| Total Cash, percent | .0 | .0 | .0 | .0 | .0 | .0 | .0 | .0 | .0 | .0 |
| Account Receivables | 217.2 | 243.5 | 238.5 | 265.9 | 340.5 | 339.0 | 370.6 | 405.2 | 442.9 | 484.2 |
| Account Receivables, % | 32.94 | 34.46 | 30.31 | 30.85 | 36.17 | 32.95 | 32.95 | 32.95 | 32.95 | 32.95 |
| Inventories | .0 | .0 | .0 | .0 | .0 | .0 | .0 | .0 | .0 | .0 |
| Inventories, % | 0 | 0 | 0 | 0 | 0 | 0 | 0 | 0 | 0 | 0 |
| Accounts Payable | 40.0 | 56.0 | 57.8 | 54.9 | 81.9 | 74.9 | 81.9 | 89.5 | 97.9 | 107.0 |
| Accounts Payable, % | 6.07 | 7.92 | 7.34 | 6.37 | 8.7 | 7.28 | 7.28 | 7.28 | 7.28 | 7.28 |
| Capital Expenditure | -9.9 | -13.9 | -15.7 | -17.2 | -16.9 | -19.0 | -20.8 | -22.7 | -24.9 | -27.2 |
| Capital Expenditure, % | -1.49 | -1.97 | -1.99 | -1.99 | -1.8 | -1.85 | -1.85 | -1.85 | -1.85 | -1.85 |
| Tax Rate, % | -6.57 | -6.57 | -6.57 | -6.57 | -6.57 | -6.57 | -6.57 | -6.57 | -6.57 | -6.57 |
| EBITAT | 32.0 | 51.9 | 53.0 | 56.6 | 46.3 | 63.3 | 69.1 | 75.6 | 82.6 | 90.3 |
| Depreciation | ||||||||||
| Changes in Account Receivables | ||||||||||
| Changes in Inventories | ||||||||||
| Changes in Accounts Payable | ||||||||||
| Capital Expenditure | ||||||||||
| UFCF | -100.0 | 82.7 | 101.1 | 67.2 | 48.4 | 115.2 | 107.4 | 117.4 | 128.3 | 140.3 |
| WACC, % | 8.59 | 8.63 | 8.67 | 8.79 | 8.87 | 8.71 | 8.71 | 8.71 | 8.71 | 8.71 |
| PV UFCF | ||||||||||
| SUM PV UFCF | 472.5 | |||||||||
| Long Term Growth Rate, % | 4.00 | |||||||||
| Free cash flow (T + 1) | 146 | |||||||||
| Terminal Value | 3,097 | |||||||||
| Present Terminal Value | 2,040 | |||||||||
| Enterprise Value | 2,512 | |||||||||
| Net Debt | 216 | |||||||||
| Equity Value | 2,296 | |||||||||
| Diluted Shares Outstanding, MM | 63 | |||||||||
| Equity Value Per Share | 36.52 |
What You Will Get
- Real NVEE Financial Data: Pre-filled with NV5 Global, Inc.'s historical and projected data for precise analysis.
- Fully Editable Template: Modify key inputs like revenue growth, WACC, and EBITDA % with ease.
- Automatic Calculations: See NV5 Global, Inc.'s intrinsic value update instantly based on your changes.
- Professional Valuation Tool: Designed for investors, analysts, and consultants seeking accurate DCF results.
- User-Friendly Design: Simple structure and clear instructions for all experience levels.
Key Features
- Customizable Financial Metrics: Adjust essential parameters such as revenue growth, EBITDA %, and capital expenses.
- Instant DCF Valuation: Quickly computes intrinsic value, NPV, and other financial metrics.
- Industry-Leading Precision: Incorporates NV5 Global, Inc.'s real financial data for accurate valuation results.
- Effortless Scenario Testing: Easily evaluate various assumptions and analyze different outcomes.
- Efficiency Booster: Remove the hassle of constructing intricate valuation models from the ground up.
How It Works
- Download the Template: Get instant access to the Excel-based NV5 Global, Inc. (NVEE) DCF Calculator.
- Input Your Assumptions: Adjust yellow-highlighted cells for growth rates, WACC, margins, and more.
- Instant Calculations: The model automatically updates NV5 Global, Inc. (NVEE)'s intrinsic value.
- Test Scenarios: Simulate different assumptions to evaluate potential valuation changes.
- Analyze and Decide: Use the results to guide your investment or financial analysis.
Why Choose This Calculator for NV5 Global, Inc. (NVEE)?
- Designed for Experts: A sophisticated tool utilized by analysts, CFOs, and industry consultants.
- Accurate Financial Data: NV5's historical and projected financials preloaded for precision.
- Flexible Scenario Analysis: Effortlessly simulate various forecasts and assumptions.
- Comprehensive Outputs: Automatically computes intrinsic value, NPV, and essential metrics.
- User-Friendly: Step-by-step guidance ensures a smooth experience.
Who Should Use NV5 Global, Inc. (NVEE)?
- Professional Investors: Develop comprehensive valuation models for informed investment decisions.
- Corporate Finance Teams: Evaluate valuation scenarios to inform strategic planning and decision-making.
- Consultants and Advisors: Deliver precise valuation insights to clients regarding NV5 Global, Inc. (NVEE).
- Students and Educators: Utilize real-world examples to enhance learning in financial modeling and analysis.
- Industry Analysts: Gain insights into how companies like NV5 Global, Inc. (NVEE) are assessed in the marketplace.
What the NV5 Global, Inc. (NVEE) Template Contains
- Comprehensive DCF Model: Editable template featuring detailed valuation calculations tailored for NV5 Global.
- Real-World Data: NV5’s historical and projected financials preloaded for comprehensive analysis.
- Customizable Parameters: Modify WACC, growth rates, and tax assumptions to explore various scenarios.
- Financial Statements: Complete annual and quarterly breakdowns for deeper financial insights.
- Key Ratios: Integrated analysis of profitability, efficiency, and leverage metrics.
- Dashboard with Visual Outputs: Engaging charts and tables for clear, actionable results.
Disclaimer
All information, articles, and product details provided on this website are for general informational and educational purposes only. We do not claim any ownership over, nor do we intend to infringe upon, any trademarks, copyrights, logos, brand names, or other intellectual property mentioned or depicted on this site. Such intellectual property remains the property of its respective owners, and any references here are made solely for identification or informational purposes, without implying any affiliation, endorsement, or partnership.
We make no representations or warranties, express or implied, regarding the accuracy, completeness, or suitability of any content or products presented. Nothing on this website should be construed as legal, tax, investment, financial, medical, or other professional advice. In addition, no part of this site—including articles or product references—constitutes a solicitation, recommendation, endorsement, advertisement, or offer to buy or sell any securities, franchises, or other financial instruments, particularly in jurisdictions where such activity would be unlawful.
All content is of a general nature and may not address the specific circumstances of any individual or entity. It is not a substitute for professional advice or services. Any actions you take based on the information provided here are strictly at your own risk. You accept full responsibility for any decisions or outcomes arising from your use of this website and agree to release us from any liability in connection with your use of, or reliance upon, the content or products found herein.