
|
The Navigator Company, S.A. (NVG.LS) Valoración de DCF |
Completamente Editable: Adáptelo A Sus Necesidades En Excel O Sheets
Diseño Profesional: Plantillas Confiables Y Estándares De La Industria
Predeterminadas Para Un Uso Rápido Y Eficiente
Compatible con MAC / PC, completamente desbloqueado
No Se Necesita Experiencia; Fáciles De Seguir
The Navigator Company, S.A. (NVG.LS) Bundle
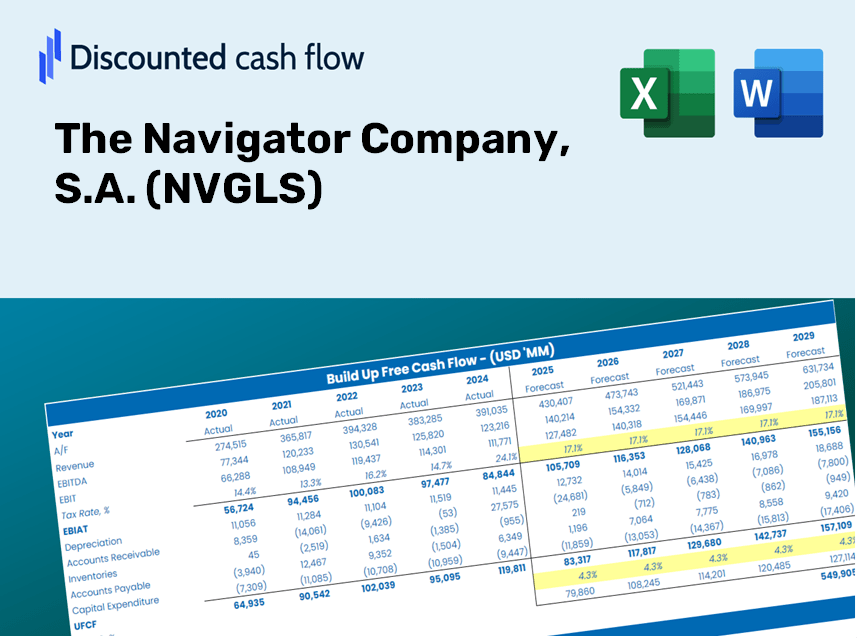
Como inversionista o analista, esta calculadora DCF (NVGLS) es su recurso de referencia para una valoración precisa. Cargados con datos reales de la compañía Navigator, S.A., puede ajustar los pronósticos y observar los efectos en tiempo real.
Discounted Cash Flow (DCF) - (USD MM)
| Year | AY1 2020 |
AY2 2021 |
AY3 2022 |
AY4 2023 |
AY5 2024 |
FY1 2025 |
FY2 2026 |
FY3 2027 |
FY4 2028 |
FY5 2029 |
|---|---|---|---|---|---|---|---|---|---|---|
| Revenue | 1,385.4 | 1,595.9 | 2,464.6 | 1,953.2 | 2,088.3 | 2,379.6 | 2,711.5 | 3,089.8 | 3,520.8 | 4,011.9 |
| Revenue Growth, % | 0 | 15.2 | 54.44 | -20.75 | 6.91 | 13.95 | 13.95 | 13.95 | 13.95 | 13.95 |
| EBITDA | 295.1 | 354.0 | 699.3 | 513.5 | 564.1 | 595.7 | 678.7 | 773.4 | 881.3 | 1,004.2 |
| EBITDA, % | 21.3 | 22.18 | 28.37 | 26.29 | 27.01 | 25.03 | 25.03 | 25.03 | 25.03 | 25.03 |
| Depreciation | 152.4 | 126.1 | 164.7 | 139.9 | 167.9 | 194.1 | 221.2 | 252.0 | 287.2 | 327.2 |
| Depreciation, % | 11 | 7.9 | 6.68 | 7.16 | 8.04 | 8.16 | 8.16 | 8.16 | 8.16 | 8.16 |
| EBIT | 142.7 | 227.9 | 534.6 | 373.6 | 396.2 | 401.6 | 457.6 | 521.4 | 594.1 | 677.0 |
| EBIT, % | 10.3 | 14.28 | 21.69 | 19.13 | 18.97 | 16.88 | 16.88 | 16.88 | 16.88 | 16.88 |
| Total Cash | 302.4 | 239.2 | 343.1 | 169.5 | 286.6 | 348.1 | 396.6 | 452.0 | 515.0 | 586.8 |
| Total Cash, percent | .0 | .0 | .0 | .0 | .0 | .0 | .0 | .0 | .0 | .0 |
| Account Receivables | 228.1 | 310.5 | 492.8 | 259.1 | 455.7 | 433.1 | 493.5 | 562.3 | 640.8 | 730.2 |
| Account Receivables, % | 16.47 | 19.46 | 19.99 | 13.26 | 21.82 | 18.2 | 18.2 | 18.2 | 18.2 | 18.2 |
| Inventories | 176.7 | 186.6 | 298.7 | 286.5 | 303.2 | 312.9 | 356.6 | 406.3 | 463.0 | 527.6 |
| Inventories, % | 12.76 | 11.69 | 12.12 | 14.67 | 14.52 | 13.15 | 13.15 | 13.15 | 13.15 | 13.15 |
| Accounts Payable | 165.9 | 174.6 | 228.1 | 221.9 | 324.5 | 281.1 | 320.4 | 365.0 | 416.0 | 474.0 |
| Accounts Payable, % | 11.97 | 10.94 | 9.26 | 11.36 | 15.54 | 11.81 | 11.81 | 11.81 | 11.81 | 11.81 |
| Capital Expenditure | -98.8 | -104.3 | -124.1 | -201.1 | -223.7 | -189.0 | -215.3 | -245.4 | -279.6 | -318.6 |
| Capital Expenditure, % | -7.13 | -6.53 | -5.03 | -10.29 | -10.71 | -7.94 | -7.94 | -7.94 | -7.94 | -7.94 |
| Tax Rate, % | 18.72 | 18.72 | 18.72 | 18.72 | 18.72 | 18.72 | 18.72 | 18.72 | 18.72 | 18.72 |
| EBITAT | 124.0 | 184.4 | 406.3 | 296.0 | 322.1 | 324.7 | 370.0 | 421.6 | 480.4 | 547.4 |
| Depreciation | ||||||||||
| Changes in Account Receivables | ||||||||||
| Changes in Inventories | ||||||||||
| Changes in Accounts Payable | ||||||||||
| Capital Expenditure | ||||||||||
| UFCF | -61.4 | 122.8 | 206.0 | 474.6 | 155.5 | 299.3 | 311.0 | 354.4 | 403.8 | 460.1 |
| WACC, % | 4.44 | 4.35 | 4.29 | 4.33 | 4.36 | 4.35 | 4.35 | 4.35 | 4.35 | 4.35 |
| PV UFCF | ||||||||||
| SUM PV UFCF | 1,596.5 | |||||||||
| Long Term Growth Rate, % | 0.50 | |||||||||
| Free cash flow (T + 1) | 462 | |||||||||
| Terminal Value | 12,000 | |||||||||
| Present Terminal Value | 9,697 | |||||||||
| Enterprise Value | 11,294 | |||||||||
| Net Debt | 729 | |||||||||
| Equity Value | 10,565 | |||||||||
| Diluted Shares Outstanding, MM | 711 | |||||||||
| Equity Value Per Share | 14.86 |
What You Will Receive
- Adjustable Forecast Assumptions: Seamlessly modify parameters (growth %, margins, WACC) to explore various scenarios.
- Industry-Specific Data: The Navigator Company’s financial data preloaded to facilitate your analysis.
- Automatic DCF Calculations: The template computes Net Present Value (NPV) and intrinsic value effortlessly.
- Tailorable and Professional Design: A refined Excel model that adjusts to meet your valuation requirements.
- Designed for Analysts and Investors: Perfect for assessing projections, validating strategies, and optimizing your time.
Key Features
- Accurate Financial Data for The Navigator Company, S.A. (NVGLS): Utilize reliable pre-loaded historical figures and future forecasts.
- Customizable Assumptions for Forecasting: Modify the yellow-highlighted cells for parameters like WACC, growth rates, and profit margins.
- Automated Calculations: Real-time updates to DCF, Net Present Value (NPV), and cash flow assessments.
- User-Friendly Dashboard: Intuitive charts and summaries to help visualize your valuation outcomes.
- Designed for All Levels: A straightforward structure tailored for investors, CFOs, and consultants alike.
How It Works
- Step 1: Download the Excel file.
- Step 2: Examine The Navigator Company, S.A.'s pre-filled financial data and forecasts.
- Step 3: Adjust key inputs such as revenue growth, WACC, and tax rates (highlighted cells).
- Step 4: Observe the DCF model update in real-time as you modify your assumptions.
- Step 5: Evaluate the outputs and utilize the findings for your investment decisions.
Why Select This Calculator for The Navigator Company (NVGLS)?
- Precise Metrics: Up-to-date financial data for The Navigator Company ensures dependable valuation outcomes.
- Flexible Settings: Tailor essential variables such as growth rates, WACC, and tax rates to align with your forecasts.
- Efficiency: Built-in calculations save you the hassle of starting from the ground up.
- High-Quality Resource: Crafted for investors, analysts, and consultants seeking in-depth insights.
- Easy to Navigate: User-friendly design and comprehensive instructions simplify the experience for all users.
Who Can Benefit from This Product?
- Individual Investors: Make informed decisions about buying or selling The Navigator Company, S.A. (NVGLS) stock.
- Financial Analysts: Enhance valuation processes with ready-to-use financial models tailored for NVGLS.
- Consultants: Provide clients with precise and timely valuation insights regarding The Navigator Company, S.A. (NVGLS).
- Business Owners: Gain an understanding of how large firms like The Navigator Company, S.A. (NVGLS) are valued to inform your strategic decisions.
- Finance Students: Explore valuation techniques using real-world data and case studies related to The Navigator Company, S.A. (NVGLS).
Contents of the Template
- Operating and Balance Sheet Data: Pre-filled historical data and forecasts for The Navigator Company, S.A. (NVGLS), including revenue, EBITDA, EBIT, and capital expenditures.
- WACC Calculation: A dedicated sheet for calculating the Weighted Average Cost of Capital (WACC), incorporating parameters such as Beta, risk-free rate, and share price.
- DCF Valuation (Unlevered and Levered): Customizable Discounted Cash Flow models that display intrinsic value along with comprehensive calculations.
- Financial Statements: Pre-loaded financial statements (both annual and quarterly) to facilitate thorough analysis.
- Key Ratios: Includes essential profitability, leverage, and efficiency ratios for The Navigator Company, S.A. (NVGLS).
- Dashboard and Charts: A visual overview of valuation outputs and assumptions to simplify result analysis.
Disclaimer
All information, articles, and product details provided on this website are for general informational and educational purposes only. We do not claim any ownership over, nor do we intend to infringe upon, any trademarks, copyrights, logos, brand names, or other intellectual property mentioned or depicted on this site. Such intellectual property remains the property of its respective owners, and any references here are made solely for identification or informational purposes, without implying any affiliation, endorsement, or partnership.
We make no representations or warranties, express or implied, regarding the accuracy, completeness, or suitability of any content or products presented. Nothing on this website should be construed as legal, tax, investment, financial, medical, or other professional advice. In addition, no part of this site—including articles or product references—constitutes a solicitation, recommendation, endorsement, advertisement, or offer to buy or sell any securities, franchises, or other financial instruments, particularly in jurisdictions where such activity would be unlawful.
All content is of a general nature and may not address the specific circumstances of any individual or entity. It is not a substitute for professional advice or services. Any actions you take based on the information provided here are strictly at your own risk. You accept full responsibility for any decisions or outcomes arising from your use of this website and agree to release us from any liability in connection with your use of, or reliance upon, the content or products found herein.