
|
Valoración DCF de Navigator Holdings Ltd. (NVGS) |
Completamente Editable: Adáptelo A Sus Necesidades En Excel O Sheets
Diseño Profesional: Plantillas Confiables Y Estándares De La Industria
Predeterminadas Para Un Uso Rápido Y Eficiente
Compatible con MAC / PC, completamente desbloqueado
No Se Necesita Experiencia; Fáciles De Seguir
Navigator Holdings Ltd. (NVGS) Bundle
¡Mejore sus estrategias de inversión con la calculadora DCF de Navigator Holdings Ltd. (NVGS)! Utilice datos financieros genuinos para el navegador, ajuste las proyecciones y gastos de crecimiento, y observe instantáneamente cómo las modificaciones afectan el valor intrínseco de los NVG.
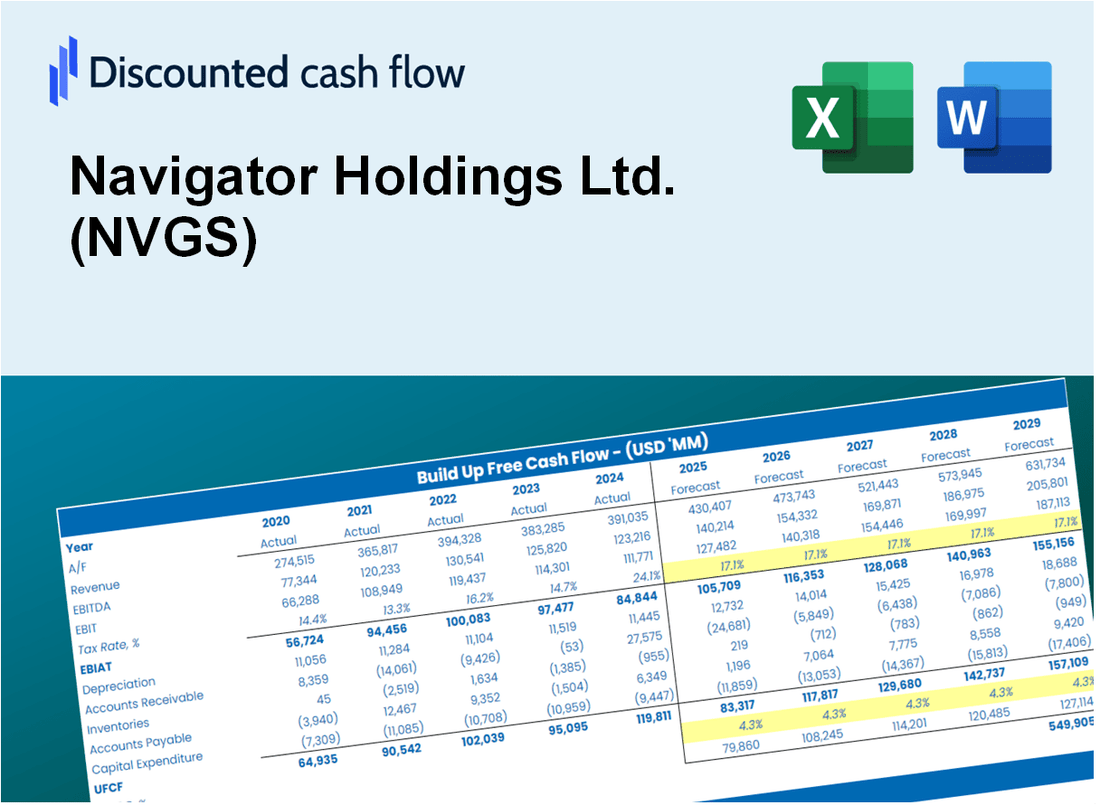
Discounted Cash Flow (DCF) - (USD MM)
| Year | AY1 2020 |
AY2 2021 |
AY3 2022 |
AY4 2023 |
AY5 2024 |
FY1 2025 |
FY2 2026 |
FY3 2027 |
FY4 2028 |
FY5 2029 |
|---|---|---|---|---|---|---|---|---|---|---|
| Revenue | 332.5 | 403.6 | 473.8 | 550.7 | 566.7 | 648.7 | 742.6 | 850.2 | 973.2 | 1,114.2 |
| Revenue Growth, % | 0 | 21.38 | 17.4 | 16.24 | 2.89 | 14.48 | 14.48 | 14.48 | 14.48 | 14.48 |
| EBITDA | 118.4 | 149.1 | 212.1 | 264.7 | 270.4 | 276.5 | 316.5 | 362.4 | 414.8 | 474.9 |
| EBITDA, % | 35.62 | 36.95 | 44.77 | 48.06 | 47.72 | 42.62 | 42.62 | 42.62 | 42.62 | 42.62 |
| Depreciation | 76.7 | 88.5 | 126.2 | 129.2 | 132.7 | 153.8 | 176.0 | 201.5 | 230.7 | 264.1 |
| Depreciation, % | 23.06 | 21.93 | 26.64 | 23.46 | 23.42 | 23.7 | 23.7 | 23.7 | 23.7 | 23.7 |
| EBIT | 41.8 | 60.6 | 85.9 | 135.5 | 137.7 | 122.7 | 140.5 | 160.9 | 184.1 | 210.8 |
| EBIT, % | 12.56 | 15.02 | 18.12 | 24.6 | 24.3 | 18.92 | 18.92 | 18.92 | 18.92 | 18.92 |
| Total Cash | 59.1 | 124.0 | 153.2 | 149.6 | 130.8 | 170.1 | 194.7 | 222.9 | 255.1 | 292.1 |
| Total Cash, percent | .0 | .0 | .0 | .0 | .0 | .0 | .0 | .0 | .0 | .0 |
| Account Receivables | 46.8 | 61.6 | 45.4 | 71.0 | 52.0 | 79.2 | 90.6 | 103.8 | 118.8 | 136.0 |
| Account Receivables, % | 14.08 | 15.28 | 9.59 | 12.9 | 9.18 | 12.2 | 12.2 | 12.2 | 12.2 | 12.2 |
| Inventories | 8.4 | 13.2 | 8.5 | 9.0 | 13.8 | 15.1 | 17.3 | 19.8 | 22.7 | 26.0 |
| Inventories, % | 2.53 | 3.26 | 1.8 | 1.64 | 2.43 | 2.33 | 2.33 | 2.33 | 2.33 | 2.33 |
| Accounts Payable | 8.6 | 11.6 | 7.8 | 11.6 | 13.8 | 15.1 | 17.3 | 19.8 | 22.7 | 25.9 |
| Accounts Payable, % | 2.58 | 2.87 | 1.64 | 2.11 | 2.44 | 2.33 | 2.33 | 2.33 | 2.33 | 2.33 |
| Capital Expenditure | -2.3 | -3.5 | -45.8 | -192.0 | -41.4 | -69.3 | -79.3 | -90.8 | -103.9 | -118.9 |
| Capital Expenditure, % | -0.68091 | -0.87715 | -9.66 | -34.86 | -7.31 | -10.68 | -10.68 | -10.68 | -10.68 | -10.68 |
| Tax Rate, % | 13.09 | 13.09 | 13.09 | 13.09 | 13.09 | 13.09 | 13.09 | 13.09 | 13.09 | 13.09 |
| EBITAT | 21.6 | 62.9 | 71.3 | 157.9 | 119.7 | 103.5 | 118.5 | 135.7 | 155.3 | 177.8 |
| Depreciation | ||||||||||
| Changes in Account Receivables | ||||||||||
| Changes in Inventories | ||||||||||
| Changes in Accounts Payable | ||||||||||
| Capital Expenditure | ||||||||||
| UFCF | 49.3 | 131.3 | 168.8 | 72.9 | 227.5 | 160.8 | 203.8 | 233.3 | 267.1 | 305.7 |
| WACC, % | 5.29 | 6.62 | 6.15 | 6.62 | 6.26 | 6.19 | 6.19 | 6.19 | 6.19 | 6.19 |
| PV UFCF | ||||||||||
| SUM PV UFCF | 963.4 | |||||||||
| Long Term Growth Rate, % | 4.00 | |||||||||
| Free cash flow (T + 1) | 318 | |||||||||
| Terminal Value | 14,536 | |||||||||
| Present Terminal Value | 10,767 | |||||||||
| Enterprise Value | 11,730 | |||||||||
| Net Debt | 726 | |||||||||
| Equity Value | 11,004 | |||||||||
| Diluted Shares Outstanding, MM | 72 | |||||||||
| Equity Value Per Share | 153.17 |
What You Will Get
- Real Navigator Data: Preloaded financials – from revenue to EBIT – based on actual and projected figures for Navigator Holdings Ltd. (NVGS).
- Full Customization: Adjust all critical parameters (yellow cells) like WACC, growth %, and tax rates to suit your analysis.
- Instant Valuation Updates: Automatic recalculations to analyze the impact of changes on Navigator Holdings Ltd.’s (NVGS) fair value.
- Versatile Excel Template: Tailored for quick edits, scenario testing, and detailed projections specific to Navigator Holdings Ltd. (NVGS).
- Time-Saving and Accurate: Skip building models from scratch while ensuring precision and flexibility in your analyses.
Key Features
- Customizable Financial Inputs: Adjust essential parameters such as revenue projections, operating margins, and capital investments.
- Instant DCF Valuation: Quickly computes intrinsic value, net present value (NPV), and additional financial metrics.
- High-Precision Outcomes: Leverages Navigator Holdings Ltd.'s (NVGS) actual financial data for accurate valuation results.
- Simplified Scenario Testing: Easily evaluate various assumptions and analyze different results side by side.
- Efficiency Booster: Remove the hassle of constructing intricate valuation models from the ground up.
How It Works
- Download the Template: Gain immediate access to the Excel-based NVGS DCF Calculator.
- Input Your Assumptions: Modify the yellow-highlighted cells for growth rates, WACC, margins, and other variables.
- Instant Calculations: The model automatically recalculates Navigator Holdings Ltd.'s intrinsic value.
- Test Scenarios: Experiment with different assumptions to assess potential changes in valuation.
- Analyze and Decide: Utilize the outcomes to inform your investment or financial analysis.
Why Choose Navigator Holdings Ltd. (NVGS)?
- Save Time: No need to start from scratch – our tools are ready for immediate use.
- Enhance Accuracy: Dependable financial data and calculations minimize valuation errors.
- Fully Customizable: Adjust the model to align with your specific assumptions and forecasts.
- Easy to Understand: Intuitive charts and outputs simplify result analysis.
- Trusted by Professionals: Developed for experts who prioritize accuracy and functionality.
Who Should Use Navigator Holdings Ltd. (NVGS)?
- Investors: Gain insights into the shipping industry with a reliable source of information.
- Financial Analysts: Streamline your analysis with detailed reports and data on NVGS's performance.
- Consultants: Adapt findings for client strategies or market assessments efficiently.
- Shipping Enthusiasts: Enhance your knowledge of maritime logistics and market trends.
- Educators and Students: Utilize NVGS as a case study in maritime economics and finance courses.
What the Template Contains
- Preloaded NVGS Data: Historical and projected financial data, including revenue, EBIT, and capital expenditures.
- DCF and WACC Models: Professional-grade sheets for calculating intrinsic value and Weighted Average Cost of Capital.
- Editable Inputs: Yellow-highlighted cells for adjusting revenue growth, tax rates, and discount rates.
- Financial Statements: Comprehensive annual and quarterly financials for deeper analysis.
- Key Ratios: Profitability, leverage, and efficiency ratios to evaluate performance.
- Dashboard and Charts: Visual summaries of valuation outcomes and assumptions.
Disclaimer
All information, articles, and product details provided on this website are for general informational and educational purposes only. We do not claim any ownership over, nor do we intend to infringe upon, any trademarks, copyrights, logos, brand names, or other intellectual property mentioned or depicted on this site. Such intellectual property remains the property of its respective owners, and any references here are made solely for identification or informational purposes, without implying any affiliation, endorsement, or partnership.
We make no representations or warranties, express or implied, regarding the accuracy, completeness, or suitability of any content or products presented. Nothing on this website should be construed as legal, tax, investment, financial, medical, or other professional advice. In addition, no part of this site—including articles or product references—constitutes a solicitation, recommendation, endorsement, advertisement, or offer to buy or sell any securities, franchises, or other financial instruments, particularly in jurisdictions where such activity would be unlawful.
All content is of a general nature and may not address the specific circumstances of any individual or entity. It is not a substitute for professional advice or services. Any actions you take based on the information provided here are strictly at your own risk. You accept full responsibility for any decisions or outcomes arising from your use of this website and agree to release us from any liability in connection with your use of, or reliance upon, the content or products found herein.