
|
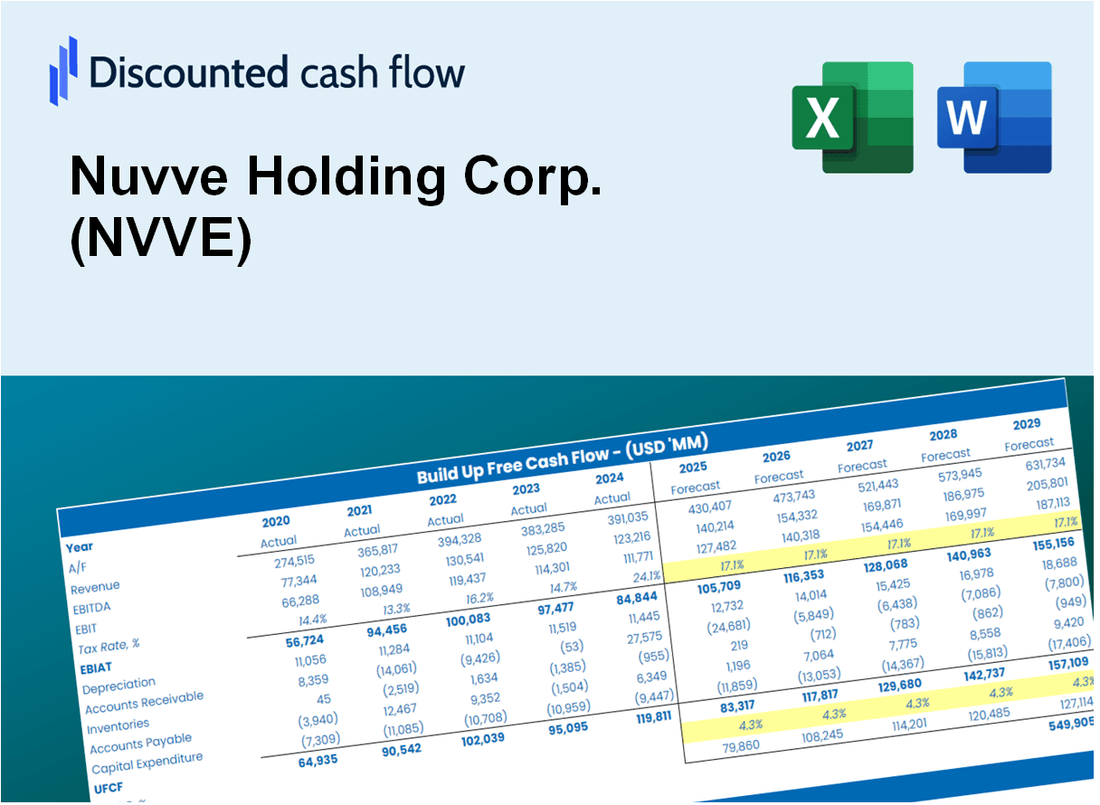
Valoración DCF de Nuvve Holding Corp. (NVVE) |
Completamente Editable: Adáptelo A Sus Necesidades En Excel O Sheets
Diseño Profesional: Plantillas Confiables Y Estándares De La Industria
Predeterminadas Para Un Uso Rápido Y Eficiente
Compatible con MAC / PC, completamente desbloqueado
No Se Necesita Experiencia; Fáciles De Seguir
Nuvve Holding Corp. (NVVE) Bundle
Como inversor o analista, esta calculadora DCF de Nuvve Holding Corp. (NVVE) es su recurso de referencia para una valoración precisa. Con datos reales de Nuvve Holding Corp., puede ajustar las previsiones y observar los efectos en tiempo real.
Discounted Cash Flow (DCF) - (USD MM)
| Year | AY1 2020 |
AY2 2021 |
AY3 2022 |
AY4 2023 |
AY5 2024 |
FY1 2025 |
FY2 2026 |
FY3 2027 |
FY4 2028 |
FY5 2029 |
|---|---|---|---|---|---|---|---|---|---|---|
| Revenue | 1.9 | 2.9 | 5.4 | 8.3 | 5.3 | 7.3 | 10.1 | 14.0 | 19.3 | 26.6 |
| Revenue Growth, % | 0 | 50.3 | 83.98 | 55.06 | -36.56 | 38.2 | 38.2 | 38.2 | 38.2 | 38.2 |
| EBITDA | -4.4 | -27.1 | -36.6 | -31.7 | -20.1 | -7.3 | -10.1 | -14.0 | -19.3 | -26.6 |
| EBITDA, % | -226.69 | -926.66 | -681.62 | -380.56 | -380.66 | -100 | -100 | -100 | -100 | -100 |
| Depreciation | .2 | .2 | .3 | .4 | .3 | .4 | .6 | .9 | 1.2 | 1.6 |
| Depreciation, % | 8.52 | 5.71 | 5.39 | 4.76 | 6.39 | 6.15 | 6.15 | 6.15 | 6.15 | 6.15 |
| EBIT | -4.6 | -27.2 | -36.9 | -32.1 | -20.5 | -7.3 | -10.1 | -14.0 | -19.3 | -26.6 |
| EBIT, % | -235.21 | -932.37 | -687.01 | -385.32 | -387.05 | -100 | -100 | -100 | -100 | -100 |
| Total Cash | 2.3 | 32.4 | 15.8 | 1.5 | .4 | 4.8 | 6.6 | 9.1 | 12.6 | 17.3 |
| Total Cash, percent | .0 | .0 | .0 | .0 | .0 | .0 | .0 | .0 | .0 | .0 |
| Account Receivables | 1.0 | 1.9 | 1.1 | 1.7 | 2.1 | 2.9 | 4.0 | 5.5 | 7.6 | 10.5 |
| Account Receivables, % | 51.46 | 64.6 | 20.29 | 20.7 | 40.64 | 39.54 | 39.54 | 39.54 | 39.54 | 39.54 |
| Inventories | 1.1 | 11.1 | 11.6 | 5.9 | 4.6 | 6.0 | 8.3 | 11.5 | 15.9 | 21.9 |
| Inventories, % | 54.16 | 380.68 | 214.98 | 70.68 | 86.87 | 82.34 | 82.34 | 82.34 | 82.34 | 82.34 |
| Accounts Payable | 3.0 | 5.7 | 2.4 | 1.7 | 1.9 | 4.4 | 6.1 | 8.4 | 11.6 | 16.0 |
| Accounts Payable, % | 152.34 | 196.49 | 44.49 | 20.33 | 35.61 | 60.09 | 60.09 | 60.09 | 60.09 | 60.09 |
| Capital Expenditure | .0 | -.3 | -.4 | -.2 | .0 | -.3 | -.4 | -.6 | -.8 | -1.2 |
| Capital Expenditure, % | -1.16 | -9.35 | -8.15 | -2.26 | -0.85874 | -4.36 | -4.36 | -4.36 | -4.36 | -4.36 |
| Tax Rate, % | 0.15615 | 0.15615 | 0.15615 | 0.15615 | 0.15615 | 0.15615 | 0.15615 | 0.15615 | 0.15615 | 0.15615 |
| EBITAT | -4.6 | -26.5 | -36.1 | -32.1 | -20.4 | -7.2 | -10.0 | -13.8 | -19.1 | -26.4 |
| Depreciation | ||||||||||
| Changes in Account Receivables | ||||||||||
| Changes in Inventories | ||||||||||
| Changes in Accounts Payable | ||||||||||
| Capital Expenditure | ||||||||||
| UFCF | -3.5 | -34.7 | -39.2 | -27.6 | -19.1 | -6.8 | -11.5 | -15.9 | -22.0 | -30.4 |
| WACC, % | 7.28 | 7.07 | 7.12 | 7.28 | 7.27 | 7.2 | 7.2 | 7.2 | 7.2 | 7.2 |
| PV UFCF | ||||||||||
| SUM PV UFCF | -67.4 | |||||||||
| Long Term Growth Rate, % | 2.00 | |||||||||
| Free cash flow (T + 1) | -31 | |||||||||
| Terminal Value | -597 | |||||||||
| Present Terminal Value | -421 | |||||||||
| Enterprise Value | -489 | |||||||||
| Net Debt | 10 | |||||||||
| Equity Value | -499 | |||||||||
| Diluted Shares Outstanding, MM | 1 | |||||||||
| Equity Value Per Share | -772.32 |
What You Will Get
- Comprehensive NVVE Financials: Access to historical and projected data for precise valuation.
- Customizable Inputs: Adjust WACC, tax rates, revenue growth, and capital expenditures as needed.
- Dynamic Calculations: Intrinsic value and NPV are computed in real-time.
- Scenario Analysis: Explore various scenarios to assess Nuvve Holding Corp.'s future prospects.
- User-Friendly Interface: Designed for professionals but easy enough for newcomers to navigate.
Key Features
- Comprehensive Nuvve Financials: Gain access to reliable pre-loaded historical data and future forecasts.
- Adjustable Forecast Parameters: Modify yellow-highlighted cells including WACC, growth rates, and profit margins.
- Real-Time Calculations: Automatic updates for DCF, Net Present Value (NPV), and cash flow assessments.
- Interactive Dashboard: User-friendly charts and summaries for visualizing your valuation outcomes.
- Designed for All Skill Levels: A straightforward, intuitive layout tailored for investors, CFOs, and consultants alike.
How It Works
- Download: Obtain the pre-formatted Excel file containing Nuvve Holding Corp.'s (NVVE) financial data.
- Customize: Modify forecasts such as revenue growth, EBITDA %, and WACC to suit your analysis.
- Update Automatically: The intrinsic value and NPV calculations refresh in real-time as you make changes.
- Test Scenarios: Develop various projections and instantly compare different outcomes.
- Make Decisions: Leverage the valuation findings to inform your investment approach.
Why Choose This Calculator for Nuvve Holding Corp. (NVVE)?
- User-Friendly Interface: Perfect for both novices and seasoned professionals.
- Customizable Inputs: Adjust parameters to tailor your analysis to specific scenarios.
- Real-Time Valuation: Observe immediate updates to Nuvve's valuation as you modify inputs.
- Preloaded Data: Comes with Nuvve's current financial information for swift evaluations.
- Relied Upon by Experts: Favored by investors and analysts for making informed choices.
Who Should Use This Product?
- Individual Investors: Make informed decisions about buying or selling Nuvve Holding Corp. (NVVE) stock.
- Financial Analysts: Streamline valuation processes with ready-to-use financial models specific to Nuvve Holding Corp. (NVVE).
- Consultants: Deliver professional valuation insights on Nuvve Holding Corp. (NVVE) to clients quickly and accurately.
- Business Owners: Understand how companies like Nuvve Holding Corp. (NVVE) are valued to guide your own strategy.
- Finance Students: Learn valuation techniques using real-world data and scenarios related to Nuvve Holding Corp. (NVVE).
What the Nuvve Template Contains
- Pre-Filled Data: Features Nuvve Holding Corp.'s historical financials and projections.
- Discounted Cash Flow Model: An editable DCF valuation model with automatic calculations.
- Weighted Average Cost of Capital (WACC): A dedicated sheet for calculating WACC based on tailored inputs.
- Key Financial Ratios: Evaluate Nuvve's profitability, efficiency, and leverage.
- Customizable Inputs: Easily modify revenue growth, margins, and tax rates.
- Clear Dashboard: Visuals and tables summarizing essential valuation outcomes.
Disclaimer
All information, articles, and product details provided on this website are for general informational and educational purposes only. We do not claim any ownership over, nor do we intend to infringe upon, any trademarks, copyrights, logos, brand names, or other intellectual property mentioned or depicted on this site. Such intellectual property remains the property of its respective owners, and any references here are made solely for identification or informational purposes, without implying any affiliation, endorsement, or partnership.
We make no representations or warranties, express or implied, regarding the accuracy, completeness, or suitability of any content or products presented. Nothing on this website should be construed as legal, tax, investment, financial, medical, or other professional advice. In addition, no part of this site—including articles or product references—constitutes a solicitation, recommendation, endorsement, advertisement, or offer to buy or sell any securities, franchises, or other financial instruments, particularly in jurisdictions where such activity would be unlawful.
All content is of a general nature and may not address the specific circumstances of any individual or entity. It is not a substitute for professional advice or services. Any actions you take based on the information provided here are strictly at your own risk. You accept full responsibility for any decisions or outcomes arising from your use of this website and agree to release us from any liability in connection with your use of, or reliance upon, the content or products found herein.