
|
FSN E-Commerce Ventures Limited (NYKAA.NS) Valoración de DCF |
Completamente Editable: Adáptelo A Sus Necesidades En Excel O Sheets
Diseño Profesional: Plantillas Confiables Y Estándares De La Industria
Predeterminadas Para Un Uso Rápido Y Eficiente
Compatible con MAC / PC, completamente desbloqueado
No Se Necesita Experiencia; Fáciles De Seguir
FSN E-Commerce Ventures Limited (NYKAA.NS) Bundle
¡Explore el potencial financiero de FSN E-Commerce Ventures Limited con nuestra calculadora DCF fácil de usar! Ingrese sus proyecciones para el crecimiento, los márgenes y los gastos para calcular el valor intrínseco de FSN E-Commerce Ventures Limited (Nykaans) y dar forma a su enfoque de inversión.
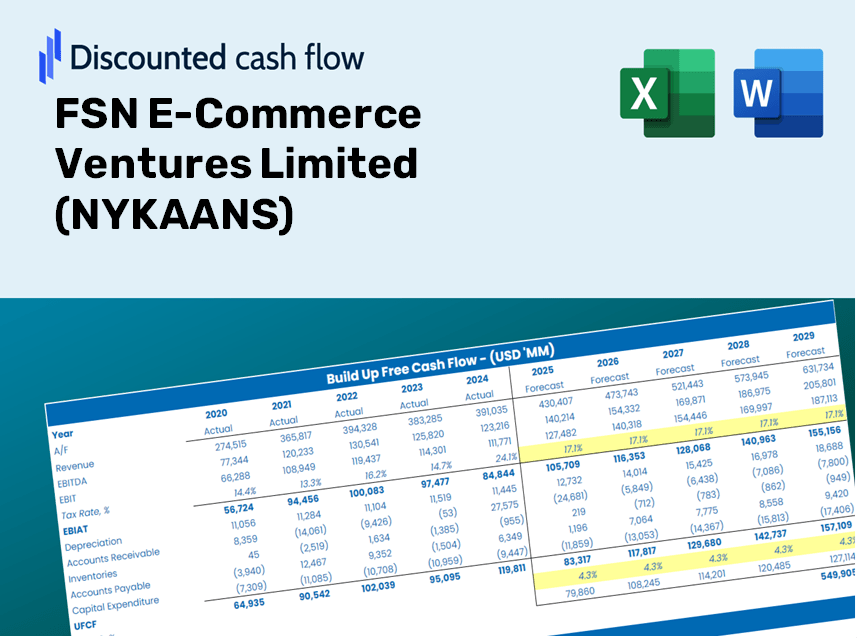
Discounted Cash Flow (DCF) - (USD MM)
| Year | AY1 2021 |
AY2 2022 |
AY3 2023 |
AY4 2024 |
AY5 2025 |
FY1 2026 |
FY2 2027 |
FY3 2028 |
FY4 2029 |
FY5 2030 |
|---|---|---|---|---|---|---|---|---|---|---|
| Revenue | 37,739.4 | 51,438.0 | 63,856.2 | 79,498.2 | 79,498.2 | 96,378.8 | 116,843.8 | 141,654.4 | 171,733.2 | 208,199.0 |
| Revenue Growth, % | 0 | 36.3 | 24.14 | 24.5 | 0 | 21.23 | 21.23 | 21.23 | 21.23 | 21.23 |
| EBITDA | 957.2 | 1,376.7 | 2,004.0 | 2,965.7 | 5,011.7 | 3,544.0 | 4,296.5 | 5,208.8 | 6,314.8 | 7,655.7 |
| EBITDA, % | 2.54 | 2.68 | 3.14 | 3.73 | 6.3 | 3.68 | 3.68 | 3.68 | 3.68 | 3.68 |
| Depreciation | 288.7 | 548.8 | 784.9 | 890.6 | 2,664.0 | 1,451.9 | 1,760.2 | 2,134.0 | 2,587.1 | 3,136.5 |
| Depreciation, % | 0.76498 | 1.07 | 1.23 | 1.12 | 3.35 | 1.51 | 1.51 | 1.51 | 1.51 | 1.51 |
| EBIT | 668.5 | 827.9 | 1,219.1 | 2,075.1 | 2,347.7 | 2,092.0 | 2,536.3 | 3,074.8 | 3,727.7 | 4,519.3 |
| EBIT, % | 1.77 | 1.61 | 1.91 | 2.61 | 2.95 | 2.17 | 2.17 | 2.17 | 2.17 | 2.17 |
| Total Cash | 2,446.0 | 6,567.1 | 2,995.0 | 2,597.8 | 2,923.2 | 5,953.0 | 7,217.0 | 8,749.5 | 10,607.4 | 12,859.7 |
| Total Cash, percent | .0 | .0 | .0 | .0 | .0 | .0 | .0 | .0 | .0 | .0 |
| Account Receivables | 926.8 | 1,839.3 | 2,630.7 | 3,125.4 | 2,466.1 | 3,312.5 | 4,015.9 | 4,868.6 | 5,902.4 | 7,155.7 |
| Account Receivables, % | 2.46 | 3.58 | 4.12 | 3.93 | 3.1 | 3.44 | 3.44 | 3.44 | 3.44 | 3.44 |
| Inventories | 4,980.9 | 8,756.0 | 10,051.4 | 11,920.5 | 14,175.4 | 15,186.8 | 18,411.6 | 22,321.1 | 27,060.7 | 32,806.8 |
| Inventories, % | 13.2 | 17.02 | 15.74 | 14.99 | 17.83 | 15.76 | 15.76 | 15.76 | 15.76 | 15.76 |
| Accounts Payable | 3,162.1 | 3,620.5 | 2,653.9 | 3,866.9 | 6,348.3 | 6,249.8 | 7,576.9 | 9,185.8 | 11,136.3 | 13,500.9 |
| Accounts Payable, % | 8.38 | 7.04 | 4.16 | 4.86 | 7.99 | 6.48 | 6.48 | 6.48 | 6.48 | 6.48 |
| Capital Expenditure | -420.7 | -939.7 | -2,081.6 | -1,107.3 | -1,272.2 | -1,772.3 | -2,148.7 | -2,604.9 | -3,158.1 | -3,828.6 |
| Capital Expenditure, % | -1.11 | -1.83 | -3.26 | -1.39 | -1.6 | -1.84 | -1.84 | -1.84 | -1.84 | -1.84 |
| Tax Rate, % | 47.48 | 47.48 | 47.48 | 47.48 | 47.48 | 47.48 | 47.48 | 47.48 | 47.48 | 47.48 |
| EBITAT | 580.4 | 461.7 | 604.6 | 1,089.8 | 1,233.0 | 1,243.7 | 1,507.7 | 1,827.9 | 2,216.0 | 2,686.6 |
| Depreciation | ||||||||||
| Changes in Account Receivables | ||||||||||
| Changes in Inventories | ||||||||||
| Changes in Accounts Payable | ||||||||||
| Capital Expenditure | ||||||||||
| UFCF | -2,297.2 | -4,158.3 | -3,745.6 | -277.6 | 3,510.6 | -1,033.1 | -1,481.8 | -1,796.4 | -2,177.9 | -2,640.3 |
| WACC, % | 5.31 | 5.26 | 5.25 | 5.25 | 5.25 | 5.27 | 5.27 | 5.27 | 5.27 | 5.27 |
| PV UFCF | ||||||||||
| SUM PV UFCF | -7,675.4 | |||||||||
| Long Term Growth Rate, % | 4.00 | |||||||||
| Free cash flow (T + 1) | -2,746 | |||||||||
| Terminal Value | -217,055 | |||||||||
| Present Terminal Value | -167,938 | |||||||||
| Enterprise Value | -175,613 | |||||||||
| Net Debt | 11,034 | |||||||||
| Equity Value | -186,648 | |||||||||
| Diluted Shares Outstanding, MM | 2,902 | |||||||||
| Equity Value Per Share | -64.31 |
What You Will Receive
- Adjustable Forecast Parameters: Modify key assumptions (growth %, margins, WACC) to develop various scenarios.
- Comprehensive Data: FSN E-Commerce Ventures Limited’s (NYKAANS) financial data pre-filled to facilitate your analysis.
- Instant DCF Calculations: The template automatically computes Net Present Value (NPV) and intrinsic value for your convenience.
- Customizable and Professional Design: A sophisticated Excel model tailored to meet your valuation requirements.
- Designed for Analysts and Investors: Perfect for evaluating projections, confirming strategies, and optimizing efficiency.
Key Features
- Real-Time FSN E-Commerce Data: Pre-filled with FSN E-Commerce Ventures Limited’s historical performance and forward-looking forecasts.
- Customizable Parameters: Tailor revenue growth rates, profit margins, discount rates, taxation, and capital investment assumptions.
- Dynamic Valuation Framework: Automatic calculations of Net Present Value (NPV) and intrinsic value based on your custom inputs.
- Scenario Analysis: Generate various forecasting scenarios to explore different valuation possibilities.
- User-Friendly Interface: Intuitive and well-structured, suitable for both experts and newcomers.
How It Operates
- Step 1: Download the ready-to-use Excel template featuring FSN E-Commerce Ventures Limited’s (NYKAANS) data.
- Step 2: Review the pre-filled sheets to familiarize yourself with the essential metrics.
- Step 3: Modify forecasts and assumptions in the editable yellow cells (WACC, growth, margins).
- Step 4: Instantly see recalculated results, including the intrinsic value of FSN E-Commerce Ventures Limited (NYKAANS).
- Step 5: Make informed investment choices or create reports based on the generated outputs.
Why Opt for This Calculator?
- Reliable Data: Authentic FSN E-Commerce Ventures Limited (NYKAANS) financials guarantee trustworthy valuation outcomes.
- Flexible: Modify essential factors such as growth projections, WACC, and tax rates to align with your forecasts.
- Efficiency: Ready-to-use calculations save you the hassle of starting from the ground up.
- Professional-Quality Tool: Tailored for investors, analysts, and consultants in the e-commerce sector.
- Easy to Use: User-friendly design and guided instructions simplify the process for all users.
Who Should Use This Product?
- Investors: Effectively assess the fair value of FSN E-Commerce Ventures Limited (NYKAANS) before making investment choices.
- CFOs: Utilize a high-quality DCF model for thorough financial reporting and analysis.
- Consultants: Easily customize the template for creating valuation reports tailored to client needs.
- Entrepreneurs: Discover valuable insights into the financial modeling practices of leading companies.
- Educators: Employ this tool as a resource for teaching valuation techniques and methodologies.
Contents of the Template
- Comprehensive DCF Model: An editable template featuring detailed valuation calculations.
- Real-World Data: Historical and projected financial figures for FSN E-Commerce Ventures Limited (NYKAANS) preloaded for in-depth analysis.
- Customizable Parameters: Modify WACC, growth rates, and tax assumptions to explore various scenarios.
- Financial Statements: Complete annual and quarterly breakdowns for enhanced insights.
- Key Ratios: Integrated analysis for evaluating profitability, efficiency, and leverage.
- Dashboard with Visual Outputs: Charts and tables providing clear, actionable insights.
Disclaimer
All information, articles, and product details provided on this website are for general informational and educational purposes only. We do not claim any ownership over, nor do we intend to infringe upon, any trademarks, copyrights, logos, brand names, or other intellectual property mentioned or depicted on this site. Such intellectual property remains the property of its respective owners, and any references here are made solely for identification or informational purposes, without implying any affiliation, endorsement, or partnership.
We make no representations or warranties, express or implied, regarding the accuracy, completeness, or suitability of any content or products presented. Nothing on this website should be construed as legal, tax, investment, financial, medical, or other professional advice. In addition, no part of this site—including articles or product references—constitutes a solicitation, recommendation, endorsement, advertisement, or offer to buy or sell any securities, franchises, or other financial instruments, particularly in jurisdictions where such activity would be unlawful.
All content is of a general nature and may not address the specific circumstances of any individual or entity. It is not a substitute for professional advice or services. Any actions you take based on the information provided here are strictly at your own risk. You accept full responsibility for any decisions or outcomes arising from your use of this website and agree to release us from any liability in connection with your use of, or reliance upon, the content or products found herein.