
|
Valoración DCF de The New York Times Company (NYT) |
Completamente Editable: Adáptelo A Sus Necesidades En Excel O Sheets
Diseño Profesional: Plantillas Confiables Y Estándares De La Industria
Predeterminadas Para Un Uso Rápido Y Eficiente
Compatible con MAC / PC, completamente desbloqueado
No Se Necesita Experiencia; Fáciles De Seguir
The New York Times Company (NYT) Bundle
¡Evalúe la perspectiva financiera de la Compañía de New York Times (NYT) como un experto! Esta calculadora DCF (NYT) viene con datos financieros precipidos y ofrece una flexibilidad total para modificar el crecimiento de los ingresos, WACC, los márgenes y otros supuestos esenciales para que coincidan con sus proyecciones.
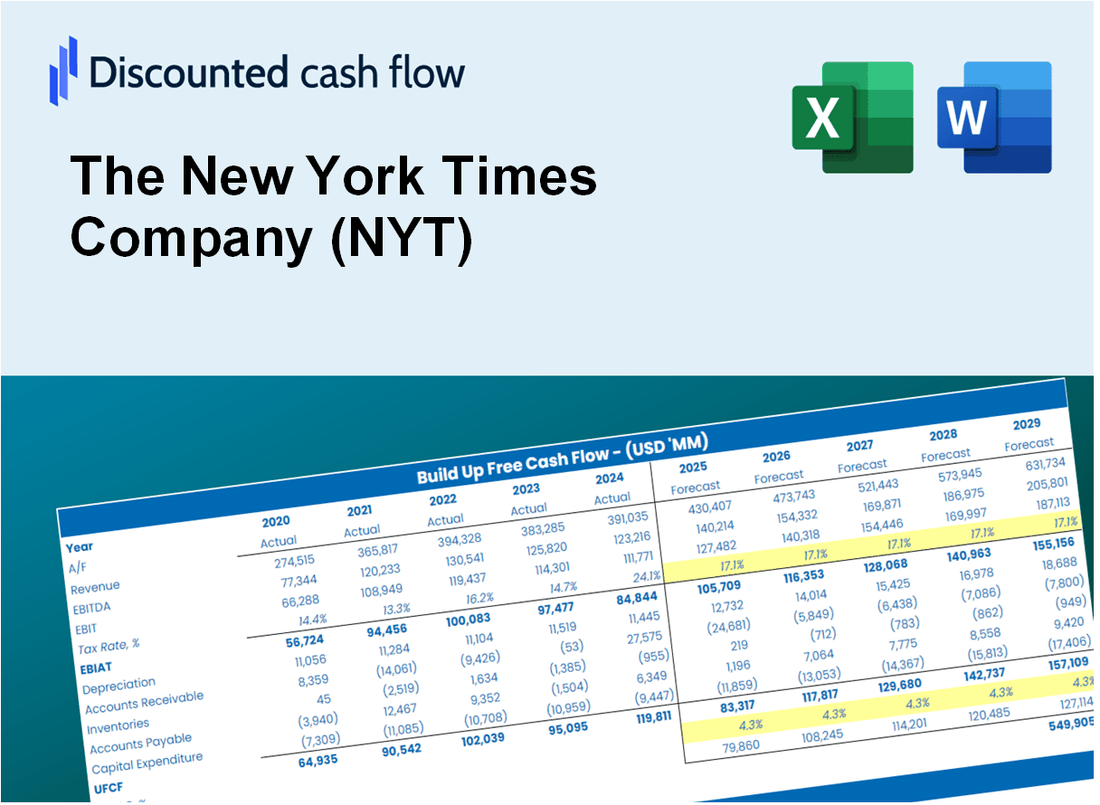
Discounted Cash Flow (DCF) - (USD MM)
| Year | AY1 2020 |
AY2 2021 |
AY3 2022 |
AY4 2023 |
AY5 2024 |
FY1 2025 |
FY2 2026 |
FY3 2027 |
FY4 2028 |
FY5 2029 |
|---|---|---|---|---|---|---|---|---|---|---|
| Revenue | 1,783.6 | 2,074.9 | 2,308.3 | 2,426.2 | 2,585.9 | 2,839.8 | 3,118.6 | 3,424.7 | 3,761.0 | 4,130.2 |
| Revenue Growth, % | 0 | 16.33 | 11.25 | 5.1 | 6.59 | 9.82 | 9.82 | 9.82 | 9.82 | 9.82 |
| EBITDA | 186.9 | 358.3 | 328.6 | 398.9 | 476.5 | 436.5 | 479.3 | 526.4 | 578.0 | 634.8 |
| EBITDA, % | 10.48 | 17.27 | 14.23 | 16.44 | 18.43 | 15.37 | 15.37 | 15.37 | 15.37 | 15.37 |
| Depreciation | 70.7 | 67.0 | 92.6 | 95.3 | 92.0 | 106.2 | 116.6 | 128.0 | 140.6 | 154.4 |
| Depreciation, % | 3.96 | 3.23 | 4.01 | 3.93 | 3.56 | 3.74 | 3.74 | 3.74 | 3.74 | 3.74 |
| EBIT | 116.2 | 291.3 | 236.0 | 303.6 | 384.4 | 330.3 | 362.7 | 398.3 | 437.4 | 480.4 |
| EBIT, % | 6.51 | 14.04 | 10.22 | 12.51 | 14.87 | 11.63 | 11.63 | 11.63 | 11.63 | 11.63 |
| Total Cash | 595.2 | 661.0 | 347.4 | 451.6 | 565.9 | 685.9 | 753.3 | 827.2 | 908.4 | 997.6 |
| Total Cash, percent | .0 | .0 | .0 | .0 | .0 | .0 | .0 | .0 | .0 | .0 |
| Account Receivables | 183.7 | 232.9 | 217.5 | 242.5 | 249.5 | 287.3 | 315.6 | 346.5 | 380.5 | 417.9 |
| Account Receivables, % | 10.3 | 11.23 | 9.42 | 9.99 | 9.65 | 10.12 | 10.12 | 10.12 | 10.12 | 10.12 |
| Inventories | .0 | .0 | .0 | .0 | .0 | .0 | .0 | .0 | .0 | .0 |
| Inventories, % | 0 | 0 | 0 | 0 | 0 | 0 | 0 | 0 | 0 | 0 |
| Accounts Payable | 123.2 | 127.1 | 114.6 | 116.9 | 123.6 | 156.7 | 172.1 | 189.0 | 207.6 | 228.0 |
| Accounts Payable, % | 6.9 | 6.12 | 4.97 | 4.82 | 4.78 | 5.52 | 5.52 | 5.52 | 5.52 | 5.52 |
| Capital Expenditure | -34.5 | -34.6 | -37.0 | -22.7 | -29.2 | -41.3 | -45.3 | -49.8 | -54.6 | -60.0 |
| Capital Expenditure, % | -1.93 | -1.67 | -1.6 | -0.93436 | -1.13 | -1.45 | -1.45 | -1.45 | -1.45 | -1.45 |
| Tax Rate, % | 23.37 | 23.37 | 23.37 | 23.37 | 23.37 | 23.37 | 23.37 | 23.37 | 23.37 | 23.37 |
| EBITAT | 100.7 | 220.6 | 173.9 | 233.2 | 294.6 | 257.3 | 282.6 | 310.3 | 340.8 | 374.3 |
| Depreciation | ||||||||||
| Changes in Account Receivables | ||||||||||
| Changes in Inventories | ||||||||||
| Changes in Accounts Payable | ||||||||||
| Capital Expenditure | ||||||||||
| UFCF | 76.5 | 207.6 | 232.5 | 283.2 | 357.1 | 317.6 | 341.1 | 374.5 | 411.3 | 451.7 |
| WACC, % | 9.14 | 9.14 | 9.14 | 9.14 | 9.14 | 9.14 | 9.14 | 9.14 | 9.14 | 9.14 |
| PV UFCF | ||||||||||
| SUM PV UFCF | 1,447.1 | |||||||||
| Long Term Growth Rate, % | 3.00 | |||||||||
| Free cash flow (T + 1) | 465 | |||||||||
| Terminal Value | 7,581 | |||||||||
| Present Terminal Value | 4,896 | |||||||||
| Enterprise Value | 6,343 | |||||||||
| Net Debt | -162 | |||||||||
| Equity Value | 6,505 | |||||||||
| Diluted Shares Outstanding, MM | 166 | |||||||||
| Equity Value Per Share | 39.24 |
What You Will Receive
- Pre-Filled Financial Model: The New York Times Company's actual data facilitates accurate DCF valuation.
- Comprehensive Forecast Control: Modify revenue growth, margins, WACC, and other essential drivers.
- Real-Time Calculations: Automatic updates provide immediate results as adjustments are made.
- Investor-Ready Template: A polished Excel file crafted for professional-level valuation.
- Customizable and Reusable: Designed for adaptability, allowing for repeated use in detailed forecasting.
Key Features
- Comprehensive NYT Data: Pre-filled with The New York Times Company's historical financials and future projections.
- Fully Customizable Inputs: Modify revenue growth, profit margins, WACC, tax rates, and capital expenditures.
- Dynamic Valuation Model: Automatic recalculations of Net Present Value (NPV) and intrinsic value based on your inputs.
- Scenario Testing: Develop multiple forecasting scenarios to explore various valuation outcomes.
- User-Friendly Design: Intuitive, organized, and crafted for both professionals and novices.
How It Works
- Download the Template: Get instant access to the Excel-based NYT DCF Calculator.
- Input Your Assumptions: Adjust yellow-highlighted cells for growth rates, WACC, margins, and more.
- Instant Calculations: The model automatically updates The New York Times Company's intrinsic value.
- Test Scenarios: Simulate different assumptions to evaluate potential valuation changes.
- Analyze and Decide: Use the results to guide your investment or financial analysis.
Why Choose The New York Times Company (NYT)?
- Stay Informed: Access a wealth of news and insights from a trusted source.
- Quality Journalism: Experience in-depth reporting and analysis from seasoned professionals.
- Engaging Content: Discover a variety of articles, podcasts, and multimedia experiences.
- Personalized Experience: Tailor your news feed to match your interests and preferences.
- Proven Track Record: Join millions of readers who rely on us for accurate and timely information.
Who Should Use This Product?
- Journalism Students: Explore reporting techniques and apply them using real-world examples from The New York Times (NYT).
- Researchers: Utilize data and insights from The New York Times (NYT) in academic projects or studies.
- Media Analysts: Evaluate media trends and analyze readership metrics for The New York Times (NYT).
- Content Creators: Enhance your storytelling skills by examining professional articles from The New York Times (NYT).
- Small Business Owners: Understand how media coverage impacts businesses by analyzing articles from The New York Times (NYT).
What the Template Contains
- Historical Data: Includes The New York Times Company's (NYT) past financials and baseline forecasts.
- DCF and Levered DCF Models: Detailed templates to calculate The New York Times Company's (NYT) intrinsic value.
- WACC Sheet: Pre-built calculations for Weighted Average Cost of Capital.
- Editable Inputs: Modify key drivers like growth rates, EBITDA %, and CAPEX assumptions.
- Quarterly and Annual Statements: A complete breakdown of The New York Times Company's (NYT) financials.
- Interactive Dashboard: Visualize valuation results and projections dynamically.
Disclaimer
All information, articles, and product details provided on this website are for general informational and educational purposes only. We do not claim any ownership over, nor do we intend to infringe upon, any trademarks, copyrights, logos, brand names, or other intellectual property mentioned or depicted on this site. Such intellectual property remains the property of its respective owners, and any references here are made solely for identification or informational purposes, without implying any affiliation, endorsement, or partnership.
We make no representations or warranties, express or implied, regarding the accuracy, completeness, or suitability of any content or products presented. Nothing on this website should be construed as legal, tax, investment, financial, medical, or other professional advice. In addition, no part of this site—including articles or product references—constitutes a solicitation, recommendation, endorsement, advertisement, or offer to buy or sell any securities, franchises, or other financial instruments, particularly in jurisdictions where such activity would be unlawful.
All content is of a general nature and may not address the specific circumstances of any individual or entity. It is not a substitute for professional advice or services. Any actions you take based on the information provided here are strictly at your own risk. You accept full responsibility for any decisions or outcomes arising from your use of this website and agree to release us from any liability in connection with your use of, or reliance upon, the content or products found herein.