
|
Olectra Greentech Limited (Olectra.NS) DCF Valoración |
Completamente Editable: Adáptelo A Sus Necesidades En Excel O Sheets
Diseño Profesional: Plantillas Confiables Y Estándares De La Industria
Predeterminadas Para Un Uso Rápido Y Eficiente
Compatible con MAC / PC, completamente desbloqueado
No Se Necesita Experiencia; Fáciles De Seguir
Olectra Greentech Limited (OLECTRA.NS) Bundle
¡Obtenga dominio sobre su análisis de valoración Olectra Greentech Limited (Olectrans) utilizando nuestra calculadora DCF de última generación! Esta plantilla de Excel viene precargada con datos auténticos (olectranos), lo que le permite ajustar preventos y supuestos para determinar con precisión el valor intrínseco de Olectra Greentech Limited.
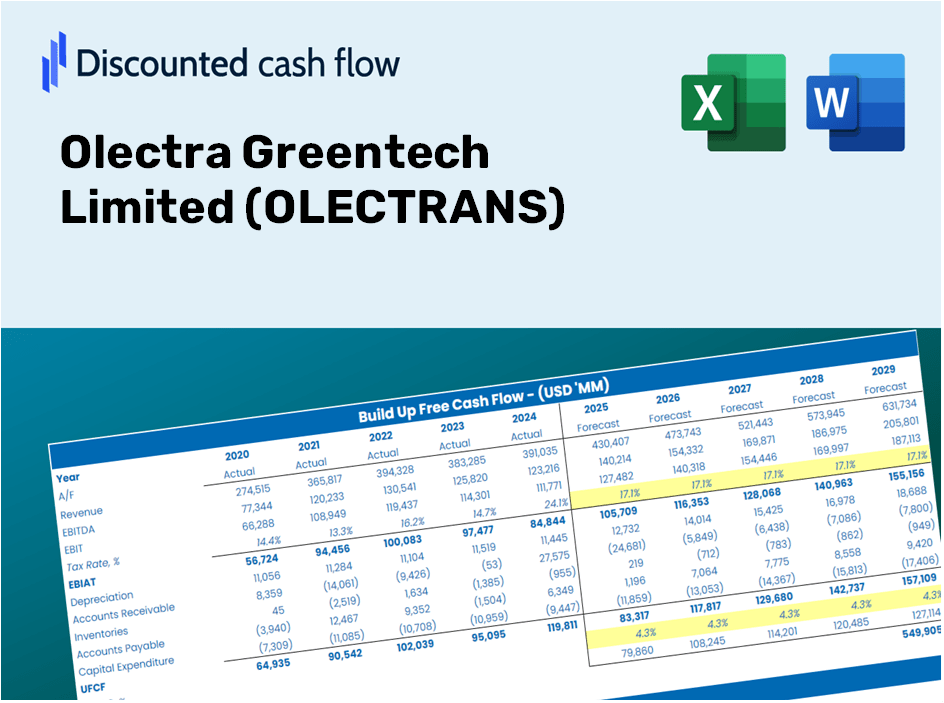
Discounted Cash Flow (DCF) - (USD MM)
| Year | AY1 2021 |
AY2 2022 |
AY3 2023 |
AY4 2024 |
AY5 2025 |
FY1 2026 |
FY2 2027 |
FY3 2028 |
FY4 2029 |
FY5 2030 |
|---|---|---|---|---|---|---|---|---|---|---|
| Revenue | 2,813.8 | 5,932.6 | 10,907.6 | 11,541.4 | 18,029.0 | 29,111.5 | 47,006.4 | 75,901.4 | 122,558.3 | 197,895.4 |
| Revenue Growth, % | 0 | 110.84 | 83.86 | 5.81 | 56.21 | 61.47 | 61.47 | 61.47 | 61.47 | 61.47 |
| EBITDA | 184.8 | 803.1 | 1,394.8 | 1,643.9 | 2,631.7 | 3,594.3 | 5,803.7 | 9,371.2 | 15,131.7 | 24,433.3 |
| EBITDA, % | 6.57 | 13.54 | 12.79 | 14.24 | 14.6 | 12.35 | 12.35 | 12.35 | 12.35 | 12.35 |
| Depreciation | 116.0 | 275.5 | 313.2 | 351.4 | 372.8 | 975.2 | 1,574.6 | 2,542.5 | 4,105.4 | 6,629.0 |
| Depreciation, % | 4.12 | 4.64 | 2.87 | 3.04 | 2.07 | 3.35 | 3.35 | 3.35 | 3.35 | 3.35 |
| EBIT | 68.8 | 527.7 | 1,081.6 | 1,292.5 | 2,258.9 | 2,619.1 | 4,229.1 | 6,828.7 | 11,026.3 | 17,804.2 |
| EBIT, % | 2.45 | 8.89 | 9.92 | 11.2 | 12.53 | 9 | 9 | 9 | 9 | 9 |
| Total Cash | 125.0 | 193.0 | 63.6 | 68.7 | 1,702.9 | 1,066.6 | 1,722.2 | 2,780.8 | 4,490.2 | 7,250.3 |
| Total Cash, percent | .0 | .0 | .0 | .0 | .0 | .0 | .0 | .0 | .0 | .0 |
| Account Receivables | 3,803.9 | 4,399.0 | 6,976.9 | 5,198.9 | 6,935.2 | 18,726.0 | 30,237.0 | 48,823.8 | 78,835.9 | 127,296.7 |
| Account Receivables, % | 135.19 | 74.15 | 63.96 | 45.05 | 38.47 | 64.33 | 64.33 | 64.33 | 64.33 | 64.33 |
| Inventories | 622.7 | 587.3 | 1,419.9 | 2,161.9 | 2,899.6 | 4,649.8 | 7,508.0 | 12,123.3 | 19,575.5 | 31,608.6 |
| Inventories, % | 22.13 | 9.9 | 13.02 | 18.73 | 16.08 | 15.97 | 15.97 | 15.97 | 15.97 | 15.97 |
| Accounts Payable | 1,391.0 | 2,719.9 | 4,380.6 | 3,894.2 | 6,663.8 | 12,002.4 | 19,380.3 | 31,293.5 | 50,529.7 | 81,590.5 |
| Accounts Payable, % | 49.43 | 45.85 | 40.16 | 33.74 | 36.96 | 41.23 | 41.23 | 41.23 | 41.23 | 41.23 |
| Capital Expenditure | -1,597.9 | -678.7 | -645.1 | -790.4 | -1,769.8 | -5,287.1 | -8,537.0 | -13,784.8 | -22,258.3 | -35,940.6 |
| Capital Expenditure, % | -56.79 | -11.44 | -5.91 | -6.85 | -9.82 | -18.16 | -18.16 | -18.16 | -18.16 | -18.16 |
| Tax Rate, % | 26.08 | 26.08 | 26.08 | 26.08 | 26.08 | 26.08 | 26.08 | 26.08 | 26.08 | 26.08 |
| EBITAT | 51.1 | 356.6 | 793.3 | 938.8 | 1,669.8 | 1,894.9 | 3,059.7 | 4,940.6 | 7,977.6 | 12,881.4 |
| Depreciation | ||||||||||
| Changes in Account Receivables | ||||||||||
| Changes in Inventories | ||||||||||
| Changes in Accounts Payable | ||||||||||
| Capital Expenditure | ||||||||||
| UFCF | -4,466.4 | 722.7 | -1,288.5 | 1,049.4 | 568.6 | -10,619.5 | -10,894.0 | -17,590.5 | -28,403.5 | -45,863.3 |
| WACC, % | 4.9 | 4.88 | 4.9 | 4.9 | 4.9 | 4.9 | 4.9 | 4.9 | 4.9 | 4.9 |
| PV UFCF | ||||||||||
| SUM PV UFCF | -94,838.2 | |||||||||
| Long Term Growth Rate, % | 2.00 | |||||||||
| Free cash flow (T + 1) | -46,781 | |||||||||
| Terminal Value | -1,615,185 | |||||||||
| Present Terminal Value | -1,271,808 | |||||||||
| Enterprise Value | -1,366,646 | |||||||||
| Net Debt | 846 | |||||||||
| Equity Value | -1,367,492 | |||||||||
| Diluted Shares Outstanding, MM | 82 | |||||||||
| Equity Value Per Share | -16,660.32 |
What You Will Receive
- Adjustable Forecast Parameters: Effortlessly modify assumptions (growth %, margins, WACC) to explore various scenarios.
- Comprehensive Market Data: Olectra Greentech Limited’s financial information pre-loaded to kickstart your analysis.
- Automated DCF Results: The template computes Net Present Value (NPV) and intrinsic value automatically.
- Professional and Tailorable: A refined Excel model that can be customized to fit your valuation requirements.
- Designed for Analysts and Investors: Perfect for evaluating projections, validating strategies, and enhancing efficiency.
Key Features
- Pre-Loaded Data: Olectra Greentech Limited’s historical financial statements and predefined forecasts.
- Fully Adjustable Inputs: Customize WACC, tax rates, revenue growth, and EBITDA margins as needed.
- Instant Results: Observe Olectra Greentech Limited’s intrinsic value update in real time.
- Clear Visual Outputs: Interactive dashboard charts showcase valuation outcomes and essential metrics.
- Built for Accuracy: A reliable tool designed for analysts, investors, and finance professionals.
How It Works
- Step 1: Download the Excel file.
- Step 2: Review the pre-filled data for Olectra Greentech Limited (OLECTRANS), including historical and projected figures.
- Step 3: Modify key assumptions (highlighted in yellow) based on your own analysis.
- Step 4: Observe the automatic recalculations of Olectra Greentech's intrinsic value.
- Step 5: Utilize the results for your investment strategies or reporting needs.
Why Choose the Olectra Greentech Calculator?
- Designed for Industry Experts: A sophisticated tool utilized by financial analysts, CFOs, and industry consultants.
- Comprehensive Data: Olectra Greentech’s historical and projected financials preloaded for precision.
- Versatile Scenario Analysis: Effortlessly simulate various forecasts and assumptions.
- Insightful Outputs: Automatically computes intrinsic value, NPV, and essential metrics.
- User-Friendly Experience: Step-by-step guidance ensures a smooth navigation through the process.
Who Can Benefit from Olectra Greentech Limited (OLECTRANS)?
- Institutional Investors: Develop comprehensive and dependable valuation models for assessing their investment strategies.
- Corporate Finance Departments: Evaluate valuation scenarios to inform and shape their business strategies.
- Consultants and Financial Advisors: Deliver precise valuation analysis and insights related to Olectra Greentech Limited (OLECTRANS) for their clients.
- Students and Academics: Utilize real-world data to enhance practical learning and teaching of financial modeling.
- Industry Enthusiasts: Explore the valuation processes of companies like Olectra Greentech Limited (OLECTRANS) within the green technology sector.
Contents of the Template
- Pre-Filled Data: Contains Olectra Greentech Limited’s historical financial performance and projections.
- Discounted Cash Flow Model: An editable DCF valuation model with automated calculations.
- Weighted Average Cost of Capital (WACC): A specific worksheet for determining WACC based on customized inputs.
- Key Financial Ratios: Evaluate Olectra Greentech's profitability, operational efficiency, and financial leverage.
- Customizable Inputs: Effortlessly modify revenue growth rates, profit margins, and tax assumptions.
- User-Friendly Dashboard: Visual representations and tables summarizing essential valuation metrics.
Disclaimer
All information, articles, and product details provided on this website are for general informational and educational purposes only. We do not claim any ownership over, nor do we intend to infringe upon, any trademarks, copyrights, logos, brand names, or other intellectual property mentioned or depicted on this site. Such intellectual property remains the property of its respective owners, and any references here are made solely for identification or informational purposes, without implying any affiliation, endorsement, or partnership.
We make no representations or warranties, express or implied, regarding the accuracy, completeness, or suitability of any content or products presented. Nothing on this website should be construed as legal, tax, investment, financial, medical, or other professional advice. In addition, no part of this site—including articles or product references—constitutes a solicitation, recommendation, endorsement, advertisement, or offer to buy or sell any securities, franchises, or other financial instruments, particularly in jurisdictions where such activity would be unlawful.
All content is of a general nature and may not address the specific circumstances of any individual or entity. It is not a substitute for professional advice or services. Any actions you take based on the information provided here are strictly at your own risk. You accept full responsibility for any decisions or outcomes arising from your use of this website and agree to release us from any liability in connection with your use of, or reliance upon, the content or products found herein.