
|
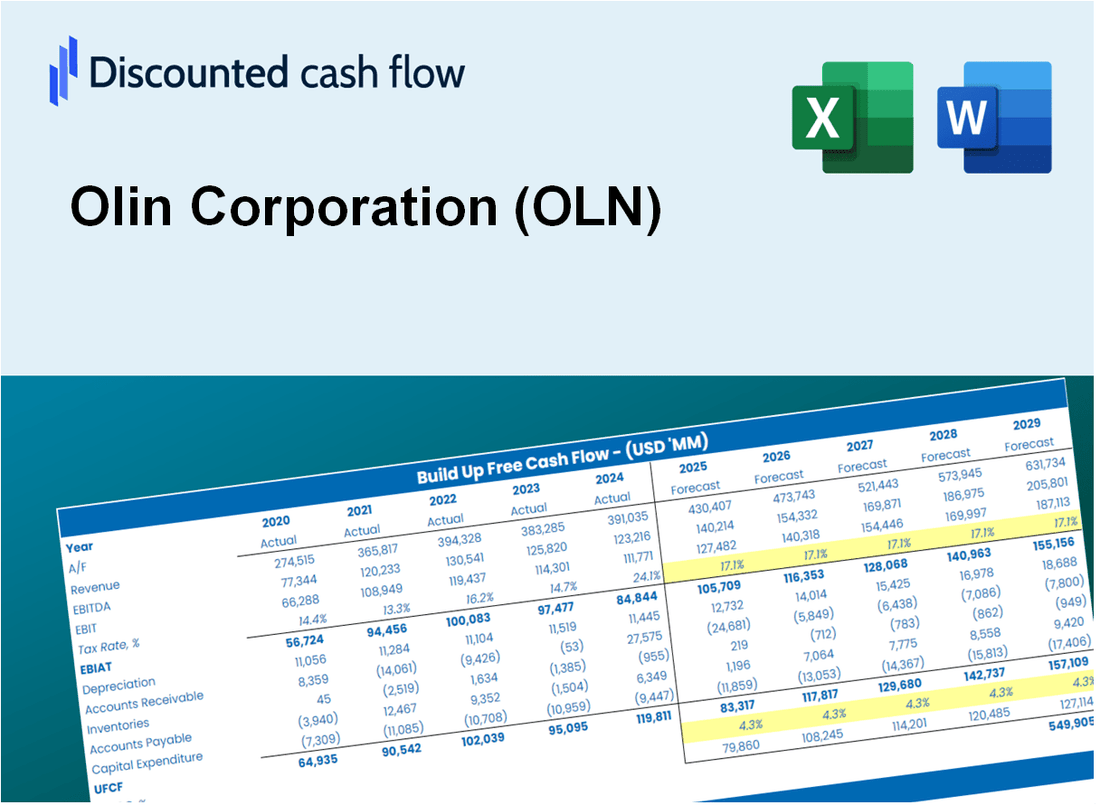
Valoración DCF de Olin Corporation (OLN) |
Completamente Editable: Adáptelo A Sus Necesidades En Excel O Sheets
Diseño Profesional: Plantillas Confiables Y Estándares De La Industria
Predeterminadas Para Un Uso Rápido Y Eficiente
Compatible con MAC / PC, completamente desbloqueado
No Se Necesita Experiencia; Fáciles De Seguir
Olin Corporation (OLN) Bundle
¡Descubra el verdadero potencial de Olin Corporation (OLN) con nuestra calculadora DCF avanzada! Ajuste los supuestos clave, explore varios escenarios y evalúe cómo los cambios afectan la valoración de Olin Corporation (OLN), todo dentro de una plantilla integral de Excel.
What You Will Receive
- Authentic OLN Financial Data: Pre-filled with Olin Corporation’s historical and forecasted data for accurate analysis.
- Completely Customizable Template: Easily adjust key inputs such as revenue growth, WACC, and EBITDA %.
- Instant Calculations: Watch Olin Corporation’s intrinsic value update immediately based on your modifications.
- Expert Valuation Tool: Tailored for investors, analysts, and consultants in search of precise DCF results.
- Intuitive Design: Clear layout and straightforward instructions suitable for all experience levels.
Key Features
- 🔍 Real-Life OLN Financials: Pre-filled historical and projected data for Olin Corporation (OLN).
- ✏️ Fully Customizable Inputs: Adjust all critical parameters (yellow cells) like WACC, growth %, and tax rates.
- 📊 Professional DCF Valuation: Built-in formulas calculate Olin’s intrinsic value using the Discounted Cash Flow method.
- ⚡ Instant Results: Visualize Olin’s valuation instantly after making changes.
- Scenario Analysis: Test and compare outcomes for various financial assumptions side-by-side.
How It Works
- Step 1: Download the prebuilt Excel template with Olin Corporation’s (OLN) data included.
- Step 2: Explore the pre-filled sheets and understand the key metrics.
- Step 3: Update forecasts and assumptions in the editable yellow cells (WACC, growth, margins).
- Step 4: Instantly view recalculated results, including Olin Corporation’s (OLN) intrinsic value.
- Step 5: Make informed investment decisions or generate reports using the outputs.
Why Choose This Calculator for Olin Corporation (OLN)?
- User-Friendly Interface: Perfect for both novices and seasoned analysts.
- Customizable Inputs: Adjust parameters effortlessly to suit your evaluation needs.
- Real-Time Feedback: Instantly view updates on Olin’s valuation as you tweak inputs.
- Preloaded Data: Comes equipped with Olin’s latest financial metrics for immediate analysis.
- Preferred by Experts: Valued by investors and analysts for making well-informed choices.
Who Should Use This Product?
- Investors: Accurately assess Olin Corporation’s (OLN) fair value prior to making investment choices.
- CFOs: Utilize a high-quality DCF model for comprehensive financial reporting and analysis of Olin Corporation (OLN).
- Consultants: Efficiently customize the template for valuation reports tailored to Olin Corporation (OLN) clients.
- Entrepreneurs: Acquire knowledge of financial modeling practices employed by leading companies like Olin Corporation (OLN).
- Educators: Implement it as a learning resource to illustrate various valuation methodologies related to Olin Corporation (OLN).
What the Template Contains
- Operating and Balance Sheet Data: Pre-filled Olin Corporation (OLN) historical data and forecasts, including revenue, EBITDA, EBIT, and capital expenditures.
- WACC Calculation: A dedicated sheet for Weighted Average Cost of Capital (WACC), including parameters like Beta, risk-free rate, and share price.
- DCF Valuation (Unlevered and Levered): Editable Discounted Cash Flow models showing intrinsic value with detailed calculations.
- Financial Statements: Pre-loaded financial statements (annual and quarterly) to support analysis.
- Key Ratios: Includes profitability, leverage, and efficiency ratios for Olin Corporation (OLN).
- Dashboard and Charts: Visual summary of valuation outputs and assumptions to analyze results easily.
Disclaimer
All information, articles, and product details provided on this website are for general informational and educational purposes only. We do not claim any ownership over, nor do we intend to infringe upon, any trademarks, copyrights, logos, brand names, or other intellectual property mentioned or depicted on this site. Such intellectual property remains the property of its respective owners, and any references here are made solely for identification or informational purposes, without implying any affiliation, endorsement, or partnership.
We make no representations or warranties, express or implied, regarding the accuracy, completeness, or suitability of any content or products presented. Nothing on this website should be construed as legal, tax, investment, financial, medical, or other professional advice. In addition, no part of this site—including articles or product references—constitutes a solicitation, recommendation, endorsement, advertisement, or offer to buy or sell any securities, franchises, or other financial instruments, particularly in jurisdictions where such activity would be unlawful.
All content is of a general nature and may not address the specific circumstances of any individual or entity. It is not a substitute for professional advice or services. Any actions you take based on the information provided here are strictly at your own risk. You accept full responsibility for any decisions or outcomes arising from your use of this website and agree to release us from any liability in connection with your use of, or reliance upon, the content or products found herein.