
|
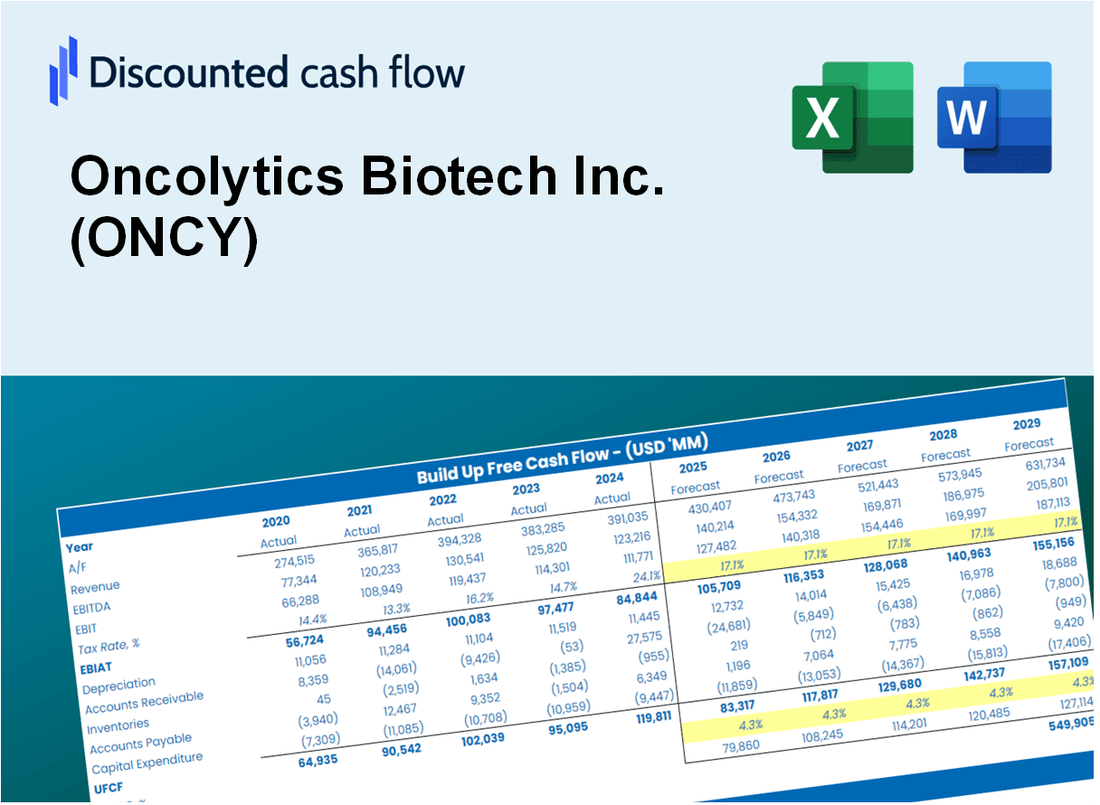
Valoración DCF de Oncolytics Biotech Inc. (ONCY) |
Completamente Editable: Adáptelo A Sus Necesidades En Excel O Sheets
Diseño Profesional: Plantillas Confiables Y Estándares De La Industria
Predeterminadas Para Un Uso Rápido Y Eficiente
Compatible con MAC / PC, completamente desbloqueado
No Se Necesita Experiencia; Fáciles De Seguir
Oncolytics Biotech Inc. (ONCY) Bundle
Ya sea que sea un inversor o analista, esta calculadora DCF (ONCY) es su recurso de referencia para una valoración precisa. Precedidos con datos reales de Oncolytics Biotech Inc., puede ajustar los pronósticos y observar los efectos al instante.
Discounted Cash Flow (DCF) - (USD MM)
| Year | AY1 2020 |
AY2 2021 |
AY3 2022 |
AY4 2023 |
AY5 2024 |
FY1 2025 |
FY2 2026 |
FY3 2027 |
FY4 2028 |
FY5 2029 |
|---|---|---|---|---|---|---|---|---|---|---|
| Revenue | .0 | .0 | .0 | .0 | .0 | .0 | .0 | .0 | .0 | .0 |
| Revenue Growth, % | 0 | 0 | 0 | 0 | 0 | 0 | 0 | 0 | 0 | 0 |
| EBITDA | -18.4 | -18.6 | -19.4 | -24.4 | -25.2 | .0 | .0 | .0 | .0 | .0 |
| EBITDA, % | 100 | 100 | 100 | 100 | 100 | 100 | 100 | 100 | 100 | 100 |
| Depreciation | .3 | .3 | .3 | .1 | .1 | .0 | .0 | .0 | .0 | .0 |
| Depreciation, % | 100 | 100 | 100 | 100 | 100 | 100 | 100 | 100 | 100 | 100 |
| EBIT | -18.7 | -18.9 | -19.7 | -24.4 | -25.3 | .0 | .0 | .0 | .0 | .0 |
| EBIT, % | 100 | 100 | 100 | 100 | 100 | 100 | 100 | 100 | 100 | 100 |
| Total Cash | 22.6 | 29.8 | 23.2 | 25.3 | 11.5 | .0 | .0 | .0 | .0 | .0 |
| Total Cash, percent | .0 | .0 | .0 | .0 | .0 | .0 | .0 | .0 | .0 | .0 |
| Account Receivables | .1 | .0 | .4 | .0 | .0 | .0 | .0 | .0 | .0 | .0 |
| Account Receivables, % | 100 | 100 | 100 | 100 | 100 | 100 | 100 | 100 | 100 | 100 |
| Inventories | .0 | .0 | .0 | .0 | .0 | .0 | .0 | .0 | .0 | .0 |
| Inventories, % | 100 | 100 | 100 | 100 | 100 | 100 | 100 | 100 | 100 | 100 |
| Accounts Payable | .0 | .4 | 1.6 | .8 | .8 | .0 | .0 | .0 | .0 | .0 |
| Accounts Payable, % | 100 | 100 | 100 | 100 | 100 | 100 | 100 | 100 | 100 | 100 |
| Capital Expenditure | .0 | -.2 | .0 | .0 | -.2 | .0 | .0 | .0 | .0 | .0 |
| Capital Expenditure, % | 100 | 100 | 100 | 100 | 100 | 0 | 0 | 0 | 0 | 0 |
| Tax Rate, % | -0.41165 | -0.41165 | -0.41165 | -0.41165 | -0.41165 | -0.41165 | -0.41165 | -0.41165 | -0.41165 | -0.41165 |
| EBITAT | -16.2 | -18.9 | -19.8 | -24.5 | -25.4 | .0 | .0 | .0 | .0 | .0 |
| Depreciation | ||||||||||
| Changes in Account Receivables | ||||||||||
| Changes in Inventories | ||||||||||
| Changes in Accounts Payable | ||||||||||
| Capital Expenditure | ||||||||||
| UFCF | -16.0 | -18.3 | -18.7 | -25.0 | -25.5 | -.7 | .0 | .0 | .0 | .0 |
| WACC, % | 9.41 | 9.41 | 9.41 | 9.41 | 9.41 | 9.41 | 9.41 | 9.41 | 9.41 | 9.41 |
| PV UFCF | ||||||||||
| SUM PV UFCF | -.7 | |||||||||
| Long Term Growth Rate, % | 2.00 | |||||||||
| Free cash flow (T + 1) | 0 | |||||||||
| Terminal Value | 0 | |||||||||
| Present Terminal Value | 0 | |||||||||
| Enterprise Value | -1 | |||||||||
| Net Debt | -11 | |||||||||
| Equity Value | 10 | |||||||||
| Diluted Shares Outstanding, MM | 76 | |||||||||
| Equity Value Per Share | 0.13 |
What You Will Receive
- Pre-Filled Financial Model: Oncolytics Biotech Inc.’s actual data allows for accurate DCF valuation.
- Comprehensive Forecast Control: Modify revenue growth, profit margins, WACC, and other critical factors.
- Real-Time Calculations: Automatic updates provide immediate feedback as you make adjustments.
- Investor-Ready Template: A polished Excel file crafted for high-quality valuation presentations.
- Customizable and Reusable: Designed for adaptability, enabling repeated use for in-depth forecasts.
Key Features
- Comprehensive DCF Analysis: Offers detailed unlevered and levered DCF valuation models tailored for Oncolytics Biotech Inc. (ONCY).
- WACC Calculation Tool: Pre-configured Weighted Average Cost of Capital sheet with adjustable parameters.
- Customizable Forecast Inputs: Easily alter growth projections, capital expenditures, and discount rates.
- Integrated Financial Ratios: Evaluate profitability, leverage, and efficiency ratios specifically for Oncolytics Biotech Inc. (ONCY).
- Interactive Dashboard and Visuals: Graphical representations that encapsulate essential valuation metrics for straightforward analysis.
How It Works
- 1. Open the Template: Download and open the Excel file containing Oncolytics Biotech Inc.'s (ONCY) preloaded data.
- 2. Edit Assumptions: Modify key inputs such as growth rates, WACC, and capital expenditures.
- 3. View Results Instantly: The DCF model automatically calculates intrinsic value and NPV based on your inputs.
- 4. Test Scenarios: Analyze various forecasts to evaluate different valuation outcomes.
- 5. Use with Confidence: Deliver professional valuation insights to enhance your decision-making process.
Why Choose Oncolytics Biotech Inc. (ONCY)?
- Innovative Treatments: Pioneering therapies that target cancer with precision.
- Strong Research Foundation: Backed by robust clinical trials and scientific validation.
- Experienced Leadership: Guided by a team of industry veterans with a proven track record.
- Commitment to Patients: Focused on improving patient outcomes and quality of life.
- Growing Pipeline: A diverse range of products in development to address unmet medical needs.
Who Should Use This Product?
- Investors: Accurately assess Oncolytics Biotech Inc.'s (ONCY) fair value before making investment choices.
- CFOs: Utilize a professional-grade DCF model for financial reporting and analysis specific to Oncolytics Biotech Inc. (ONCY).
- Consultants: Efficiently customize the template for valuation reports tailored to clients interested in Oncolytics Biotech Inc. (ONCY).
- Entrepreneurs: Acquire insights into financial modeling practices employed by leading biotech firms.
- Educators: Implement it as a teaching resource to illustrate valuation methodologies in the biotech sector.
What the Template Contains
- Pre-Filled Data: Contains Oncolytics Biotech Inc.'s historical financials and projections.
- Discounted Cash Flow Model: Editable DCF valuation model with automatic calculations.
- Weighted Average Cost of Capital (WACC): A dedicated sheet for calculating WACC based on custom inputs.
- Key Financial Ratios: Assess Oncolytics Biotech Inc.'s profitability, efficiency, and leverage.
- Customizable Inputs: Easily modify revenue growth, margins, and tax rates.
- Clear Dashboard: Visuals and tables summarizing key valuation outcomes.
Disclaimer
All information, articles, and product details provided on this website are for general informational and educational purposes only. We do not claim any ownership over, nor do we intend to infringe upon, any trademarks, copyrights, logos, brand names, or other intellectual property mentioned or depicted on this site. Such intellectual property remains the property of its respective owners, and any references here are made solely for identification or informational purposes, without implying any affiliation, endorsement, or partnership.
We make no representations or warranties, express or implied, regarding the accuracy, completeness, or suitability of any content or products presented. Nothing on this website should be construed as legal, tax, investment, financial, medical, or other professional advice. In addition, no part of this site—including articles or product references—constitutes a solicitation, recommendation, endorsement, advertisement, or offer to buy or sell any securities, franchises, or other financial instruments, particularly in jurisdictions where such activity would be unlawful.
All content is of a general nature and may not address the specific circumstances of any individual or entity. It is not a substitute for professional advice or services. Any actions you take based on the information provided here are strictly at your own risk. You accept full responsibility for any decisions or outcomes arising from your use of this website and agree to release us from any liability in connection with your use of, or reliance upon, the content or products found herein.