
|
Valoración DCF de Orion Office REIT Inc. (ONL) |
Completamente Editable: Adáptelo A Sus Necesidades En Excel O Sheets
Diseño Profesional: Plantillas Confiables Y Estándares De La Industria
Predeterminadas Para Un Uso Rápido Y Eficiente
Compatible con MAC / PC, completamente desbloqueado
No Se Necesita Experiencia; Fáciles De Seguir
Orion Office REIT Inc. (ONL) Bundle
¡Simplifique la valoración de Orion Office Reit Inc. (ONL) con esta calculadora DCF personalizable! Con Real Orion Office Reit Inc. (ONL) financieras y aportes de pronóstico ajustable, puede probar escenarios y descubrir el valor razonable de Orion Office Reit Inc. (ONL) en minutos.
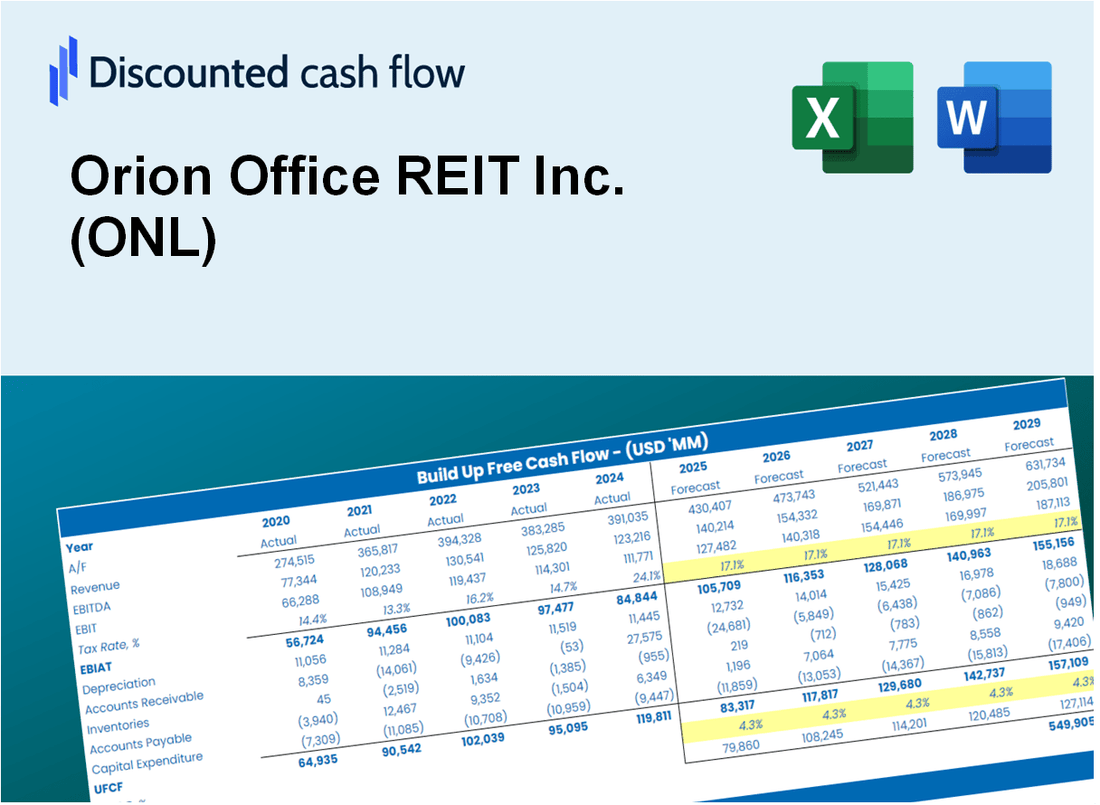
Discounted Cash Flow (DCF) - (USD MM)
| Year | AY1 2020 |
AY2 2021 |
AY3 2022 |
AY4 2023 |
AY5 2024 |
FY1 2025 |
FY2 2026 |
FY3 2027 |
FY4 2028 |
FY5 2029 |
|---|---|---|---|---|---|---|---|---|---|---|
| Revenue | 53.5 | 79.7 | 208.1 | 195.0 | 164.9 | 217.3 | 286.5 | 377.8 | 498.0 | 656.6 |
| Revenue Growth, % | 0 | 49.1 | 161.03 | -6.28 | -15.47 | 31.84 | 31.84 | 31.84 | 31.84 | 31.84 |
| EBITDA | 27.0 | .9 | 64.3 | 81.9 | 30.7 | 62.2 | 82.0 | 108.1 | 142.5 | 187.9 |
| EBITDA, % | 50.46 | 1.11 | 30.88 | 42 | 18.62 | 28.61 | 28.61 | 28.61 | 28.61 | 28.61 |
| Depreciation | 26.0 | 43.9 | 131.4 | 109.1 | 100.8 | 123.4 | 162.7 | 214.4 | 282.7 | 372.7 |
| Depreciation, % | 48.53 | 55.09 | 63.12 | 55.94 | 61.15 | 56.77 | 56.77 | 56.77 | 56.77 | 56.77 |
| EBIT | 1.0 | -43.0 | -67.1 | -27.2 | -70.1 | -61.2 | -80.7 | -106.4 | -140.2 | -184.8 |
| EBIT, % | 1.93 | -53.98 | -32.24 | -13.94 | -42.54 | -28.15 | -28.15 | -28.15 | -28.15 | -28.15 |
| Total Cash | .0 | 29.3 | 20.6 | 22.5 | 15.6 | 29.4 | 38.8 | 51.1 | 67.4 | 88.9 |
| Total Cash, percent | .0 | .0 | .0 | .0 | .0 | .0 | .0 | .0 | .0 | .0 |
| Account Receivables | 8.1 | 17.9 | 21.6 | 24.7 | 22.8 | 32.4 | 42.7 | 56.3 | 74.2 | 97.8 |
| Account Receivables, % | 15.11 | 22.47 | 10.4 | 12.65 | 13.85 | 14.89 | 14.89 | 14.89 | 14.89 | 14.89 |
| Inventories | .0 | .0 | .0 | .0 | .0 | .0 | .0 | .0 | .0 | .0 |
| Inventories, % | 0 | 0 | 0 | 0 | 0 | 0 | 0 | 0 | 0 | 0 |
| Accounts Payable | .0 | 1.8 | 1.8 | 1.6 | 1.2 | 2.0 | 2.7 | 3.5 | 4.7 | 6.1 |
| Accounts Payable, % | 0.02244081 | 2.26 | 0.86153 | 0.82342 | 0.70301 | 0.93485 | 0.93485 | 0.93485 | 0.93485 | 0.93485 |
| Capital Expenditure | -.5 | -9.9 | -11.6 | -18.4 | -22.6 | -18.3 | -24.1 | -31.8 | -41.9 | -55.2 |
| Capital Expenditure, % | -0.86771 | -12.44 | -5.59 | -9.46 | -13.69 | -8.41 | -8.41 | -8.41 | -8.41 | -8.41 |
| Tax Rate, % | -0.24328 | -0.24328 | -0.24328 | -0.24328 | -0.24328 | -0.24328 | -0.24328 | -0.24328 | -0.24328 | -0.24328 |
| EBITAT | 1.0 | -43.2 | -67.3 | -27.4 | -70.3 | -61.2 | -80.7 | -106.4 | -140.2 | -184.8 |
| Depreciation | ||||||||||
| Changes in Account Receivables | ||||||||||
| Changes in Inventories | ||||||||||
| Changes in Accounts Payable | ||||||||||
| Capital Expenditure | ||||||||||
| UFCF | 18.5 | -17.2 | 48.8 | 60.1 | 9.3 | 35.3 | 48.2 | 63.6 | 83.8 | 110.5 |
| WACC, % | 7.23 | 7.23 | 7.23 | 7.23 | 7.23 | 7.23 | 7.23 | 7.23 | 7.23 | 7.23 |
| PV UFCF | ||||||||||
| SUM PV UFCF | 267.8 | |||||||||
| Long Term Growth Rate, % | 2.00 | |||||||||
| Free cash flow (T + 1) | 113 | |||||||||
| Terminal Value | 2,157 | |||||||||
| Present Terminal Value | 1,522 | |||||||||
| Enterprise Value | 1,790 | |||||||||
| Net Debt | 495 | |||||||||
| Equity Value | 1,295 | |||||||||
| Diluted Shares Outstanding, MM | 56 | |||||||||
| Equity Value Per Share | 23.16 |
What You Will Receive
- Customizable Excel Template: A fully adjustable Excel-based DCF Calculator featuring pre-filled real ONL financials.
- Real-Time Data: Historical data and forward-looking estimates (highlighted in the yellow cells).
- Flexible Forecasting: Adjust forecast parameters such as revenue growth, EBITDA %, and WACC.
- Instant Calculations: Quickly observe how your inputs affect Orion Office REIT's valuation.
- Professional Resource: Designed for investors, CFOs, consultants, and financial analysts.
- User-Friendly Interface: Organized for clarity and ease of navigation, complete with step-by-step guidance.
Key Features
- Customizable Investment Metrics: Adjust essential factors such as occupancy rates, rental income growth, and property expenses.
- Instant Property Valuation: Provides immediate assessments of intrinsic value, cash flow, and other key metrics.
- Industry-Leading Precision: Utilizes Orion Office REIT Inc.'s (ONL) actual performance data for accurate valuation results.
- Seamless Scenario Testing: Easily explore various market conditions and assess their impact on outcomes.
- Efficiency Booster: Streamlines the valuation process, removing the hassle of constructing intricate models from the ground up.
How It Works
- 1. Access the Template: Download and open the Excel file containing Orion Office REIT Inc.'s (ONL) preloaded data.
- 2. Modify Assumptions: Adjust key inputs such as occupancy rates, cap rates, and operating expenses.
- 3. Analyze Results Instantly: The DCF model automatically computes intrinsic value and NPV based on your inputs.
- 4. Explore Scenarios: Evaluate various forecasts to understand different valuation possibilities.
- 5. Present with Confidence: Deliver professional valuation insights to back your investment decisions.
Why Choose This Calculator for Orion Office REIT Inc. (ONL)?
- Accurate Data: Utilize real financials from Orion Office REIT for dependable valuation outcomes.
- Customizable: Tailor essential parameters such as growth rates, WACC, and tax rates to align with your forecasts.
- Time-Saving: Pre-configured calculations streamline the process, so you don’t have to start from scratch.
- Professional-Grade Tool: Crafted for investors, analysts, and consultants focusing on real estate investment trusts.
- User-Friendly: Designed with an intuitive interface and clear instructions, making it accessible for all users.
Who Should Use This Product?
- Real Estate Investors: Develop comprehensive and accurate valuation models for property investment analysis.
- Property Management Teams: Assess valuation scenarios to inform operational strategies.
- Financial Advisors: Offer clients precise valuation insights for Orion Office REIT Inc. (ONL) investments.
- Students and Educators: Utilize real estate data to practice and teach financial modeling techniques.
- Market Analysts: Gain insights into how office REITs like Orion Office REIT Inc. (ONL) are valued in the real estate market.
What the Template Contains
- Historical Data: Includes Orion Office REIT Inc.’s (ONL) past financials and baseline forecasts.
- DCF and Levered DCF Models: Detailed templates to calculate Orion Office REIT Inc.’s (ONL) intrinsic value.
- WACC Sheet: Pre-built calculations for Weighted Average Cost of Capital.
- Editable Inputs: Modify key drivers like growth rates, EBITDA %, and CAPEX assumptions.
- Quarterly and Annual Statements: A complete breakdown of Orion Office REIT Inc.’s (ONL) financials.
- Interactive Dashboard: Visualize valuation results and projections dynamically.
Disclaimer
All information, articles, and product details provided on this website are for general informational and educational purposes only. We do not claim any ownership over, nor do we intend to infringe upon, any trademarks, copyrights, logos, brand names, or other intellectual property mentioned or depicted on this site. Such intellectual property remains the property of its respective owners, and any references here are made solely for identification or informational purposes, without implying any affiliation, endorsement, or partnership.
We make no representations or warranties, express or implied, regarding the accuracy, completeness, or suitability of any content or products presented. Nothing on this website should be construed as legal, tax, investment, financial, medical, or other professional advice. In addition, no part of this site—including articles or product references—constitutes a solicitation, recommendation, endorsement, advertisement, or offer to buy or sell any securities, franchises, or other financial instruments, particularly in jurisdictions where such activity would be unlawful.
All content is of a general nature and may not address the specific circumstances of any individual or entity. It is not a substitute for professional advice or services. Any actions you take based on the information provided here are strictly at your own risk. You accept full responsibility for any decisions or outcomes arising from your use of this website and agree to release us from any liability in connection with your use of, or reliance upon, the content or products found herein.