
|
Oxford Nanopore Technologies PLC (Ont.L) DCF Valoración |
Completamente Editable: Adáptelo A Sus Necesidades En Excel O Sheets
Diseño Profesional: Plantillas Confiables Y Estándares De La Industria
Predeterminadas Para Un Uso Rápido Y Eficiente
Compatible con MAC / PC, completamente desbloqueado
No Se Necesita Experiencia; Fáciles De Seguir
Oxford Nanopore Technologies plc (ONT.L) Bundle
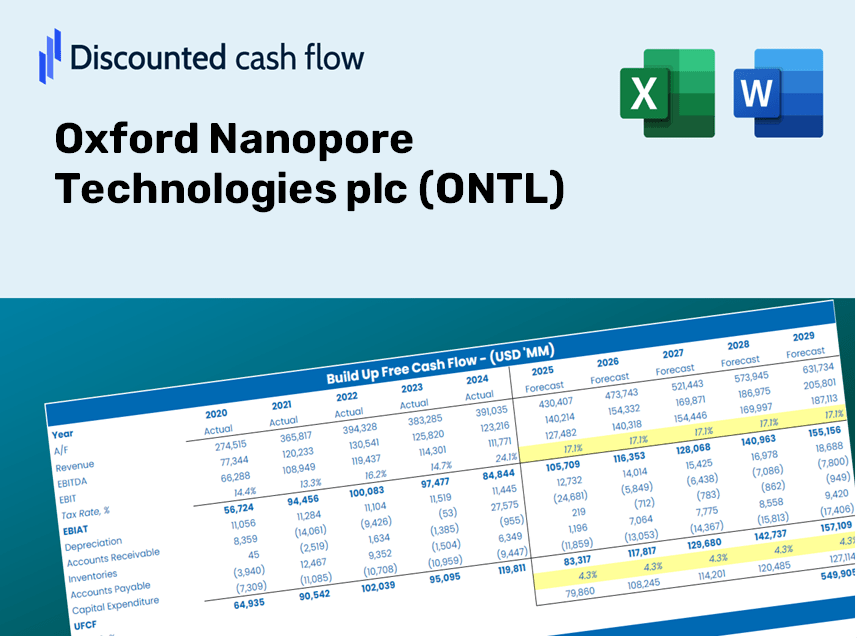
¡Obtenga información sobre su análisis de valoración de Oxford Nanopore Technologies PLC (ONTL) utilizando nuestra sofisticada calculadora DCF! Esta plantilla de Excel viene precargada con datos reales (ONTL), lo que le permite ajustar los pronósticos y supuestos para determinar con precisión el valor intrínseco de Oxford Nanopore Technologies PLC.
Discounted Cash Flow (DCF) - (USD MM)
| Year | AY1 2020 |
AY2 2021 |
AY3 2022 |
AY4 2023 |
AY5 2024 |
FY1 2025 |
FY2 2026 |
FY3 2027 |
FY4 2028 |
FY5 2029 |
|---|---|---|---|---|---|---|---|---|---|---|
| Revenue | 113.9 | 133.7 | 198.6 | 169.7 | 183.2 | 210.4 | 241.6 | 277.5 | 318.7 | 366.0 |
| Revenue Growth, % | 0 | 17.39 | 48.59 | -14.57 | 7.97 | 14.84 | 14.84 | 14.84 | 14.84 | 14.84 |
| EBITDA | -55.1 | -140.3 | -49.7 | -105.7 | -93.1 | -120.6 | -138.4 | -159.0 | -182.6 | -209.7 |
| EBITDA, % | -48.37 | -105 | -25.01 | -62.3 | -50.82 | -57.3 | -57.3 | -57.3 | -57.3 | -57.3 |
| Depreciation | 17.3 | 24.7 | 31.9 | 41.6 | 43.3 | 41.2 | 47.3 | 54.3 | 62.4 | 71.7 |
| Depreciation, % | 15.22 | 18.47 | 16.05 | 24.53 | 23.63 | 19.58 | 19.58 | 19.58 | 19.58 | 19.58 |
| EBIT | -72.4 | -165.0 | -81.5 | -147.3 | -136.4 | -154.0 | -176.8 | -203.1 | -233.2 | -267.8 |
| EBIT, % | -63.59 | -123.47 | -41.06 | -86.84 | -74.45 | -73.19 | -73.19 | -73.19 | -73.19 | -73.19 |
| Total Cash | 80.9 | 618.5 | 476.2 | 270.1 | 338.4 | 198.2 | 227.6 | 261.4 | 300.2 | 344.8 |
| Total Cash, percent | .0 | .0 | .0 | .0 | .0 | .0 | .0 | .0 | .0 | .0 |
| Account Receivables | 52.2 | 41.3 | 47.0 | 33.8 | 69.4 | 66.6 | 76.5 | 87.8 | 100.9 | 115.8 |
| Account Receivables, % | 45.86 | 30.93 | 23.65 | 19.94 | 37.86 | 31.65 | 31.65 | 31.65 | 31.65 | 31.65 |
| Inventories | 35.6 | 63.1 | 87.7 | 101.5 | 99.5 | 99.6 | 114.4 | 131.4 | 150.9 | 173.3 |
| Inventories, % | 31.29 | 47.19 | 44.16 | 59.85 | 54.29 | 47.36 | 47.36 | 47.36 | 47.36 | 47.36 |
| Accounts Payable | 31.0 | 20.5 | 23.1 | 25.2 | 31.3 | 36.2 | 41.6 | 47.8 | 54.9 | 63.0 |
| Accounts Payable, % | 27.23 | 15.33 | 11.63 | 14.84 | 17.09 | 17.22 | 17.22 | 17.22 | 17.22 | 17.22 |
| Capital Expenditure | -26.5 | -30.8 | -42.2 | -27.3 | -13.9 | -38.4 | -44.1 | -50.7 | -58.2 | -66.8 |
| Capital Expenditure, % | -23.25 | -23.06 | -21.27 | -16.08 | -7.61 | -18.25 | -18.25 | -18.25 | -18.25 | -18.25 |
| Tax Rate, % | -4.46 | -4.46 | -4.46 | -4.46 | -4.46 | -4.46 | -4.46 | -4.46 | -4.46 | -4.46 |
| EBITAT | -60.6 | -166.6 | -89.0 | -152.0 | -142.5 | -149.0 | -171.1 | -196.5 | -225.6 | -259.1 |
| Depreciation | ||||||||||
| Changes in Account Receivables | ||||||||||
| Changes in Inventories | ||||||||||
| Changes in Accounts Payable | ||||||||||
| Capital Expenditure | ||||||||||
| UFCF | -126.6 | -199.8 | -127.0 | -136.3 | -140.4 | -138.6 | -187.2 | -214.9 | -246.8 | -283.5 |
| WACC, % | 7.58 | 7.63 | 7.63 | 7.63 | 7.63 | 7.62 | 7.62 | 7.62 | 7.62 | 7.62 |
| PV UFCF | ||||||||||
| SUM PV UFCF | -843.2 | |||||||||
| Long Term Growth Rate, % | 2.00 | |||||||||
| Free cash flow (T + 1) | -289 | |||||||||
| Terminal Value | -5,145 | |||||||||
| Present Terminal Value | -3,564 | |||||||||
| Enterprise Value | -4,407 | |||||||||
| Net Debt | -154 | |||||||||
| Equity Value | -4,254 | |||||||||
| Diluted Shares Outstanding, MM | 898 | |||||||||
| Equity Value Per Share | -473.80 |
What You Will Receive
- Authentic ONTL Financial Data: Pre-loaded with Oxford Nanopore Technologies' historical and projected figures for accurate analysis.
- Completely Customizable Template: Easily adjust key inputs such as revenue growth, WACC, and EBITDA percentages.
- Instant Calculations: Observe real-time updates of Oxford Nanopore's intrinsic value based on your modifications.
- Expert Valuation Tool: Tailored for investors, analysts, and consultants who require precise DCF evaluations.
- Intuitive Design: Clear layout and straightforward instructions suitable for users of all levels.
Key Features
- 🔍 Real-Life ONTL Financials: Pre-filled historical and projected data for Oxford Nanopore Technologies plc.
- ✏️ Fully Customizable Inputs: Modify all essential parameters (yellow cells) such as WACC, growth %, and tax rates.
- 📊 Professional DCF Valuation: Integrated formulas compute the intrinsic value of Oxford Nanopore Technologies using the Discounted Cash Flow method.
- ⚡ Instant Results: Visualize ONTL's valuation immediately after making adjustments.
- Scenario Analysis: Evaluate and compare outcomes for various financial assumptions side-by-side.
How It Works
- Step 1: Download the prebuilt Excel template featuring Oxford Nanopore Technologies plc’s (ONTL) data.
- Step 2: Navigate through the pre-filled sheets to familiarize yourself with the essential metrics.
- Step 3: Revise forecasts and assumptions in the editable yellow cells (WACC, growth, margins).
- Step 4: Instantly observe recalibrated results, including Oxford Nanopore's intrinsic value.
- Step 5: Make well-informed investment choices or create reports based on the generated outputs.
Why Opt for This Calculator?
- Precision: Utilizes actual financial figures from Oxford Nanopore Technologies plc (ONTL) for reliable data.
- Adaptability: Engineered to allow users to experiment and adjust inputs with ease.
- Efficient: Avoid the complexities of constructing a DCF model from the ground up.
- Expert-Level: Crafted with a focus on CFO-level accuracy and user experience.
- Intuitive: Simple to navigate, even for those without extensive financial modeling skills.
Who Can Benefit from This Product?
- Research Scientists: Develop precise and reliable sequencing protocols for experimental analysis.
- Genomics Professionals: Assess genetic data to inform research and clinical decisions.
- Healthcare Consultants: Offer clients informed insights into the genomic landscape related to ONT (ONTL) technologies.
- Students and Educators: Utilize real-time data to enhance learning and teaching in genomics and bioinformatics.
- Biotechnology Enthusiasts: Gain a deeper understanding of how companies like Oxford Nanopore are innovating in the market.
What the Template Contains
- Historical Data: Includes Oxford Nanopore Technologies' past financials and baseline forecasts.
- DCF and Levered DCF Models: Comprehensive templates for calculating the intrinsic value of Oxford Nanopore Technologies (ONTL).
- WACC Sheet: Pre-constructed calculations for the Weighted Average Cost of Capital.
- Editable Inputs: Adjust key metrics such as growth rates, EBITDA %, and CAPEX assumptions.
- Quarterly and Annual Statements: A thorough analysis of Oxford Nanopore Technologies' financial performance.
- Interactive Dashboard: Dynamically visualize valuation outcomes and projections.
Disclaimer
All information, articles, and product details provided on this website are for general informational and educational purposes only. We do not claim any ownership over, nor do we intend to infringe upon, any trademarks, copyrights, logos, brand names, or other intellectual property mentioned or depicted on this site. Such intellectual property remains the property of its respective owners, and any references here are made solely for identification or informational purposes, without implying any affiliation, endorsement, or partnership.
We make no representations or warranties, express or implied, regarding the accuracy, completeness, or suitability of any content or products presented. Nothing on this website should be construed as legal, tax, investment, financial, medical, or other professional advice. In addition, no part of this site—including articles or product references—constitutes a solicitation, recommendation, endorsement, advertisement, or offer to buy or sell any securities, franchises, or other financial instruments, particularly in jurisdictions where such activity would be unlawful.
All content is of a general nature and may not address the specific circumstances of any individual or entity. It is not a substitute for professional advice or services. Any actions you take based on the information provided here are strictly at your own risk. You accept full responsibility for any decisions or outcomes arising from your use of this website and agree to release us from any liability in connection with your use of, or reliance upon, the content or products found herein.