
|
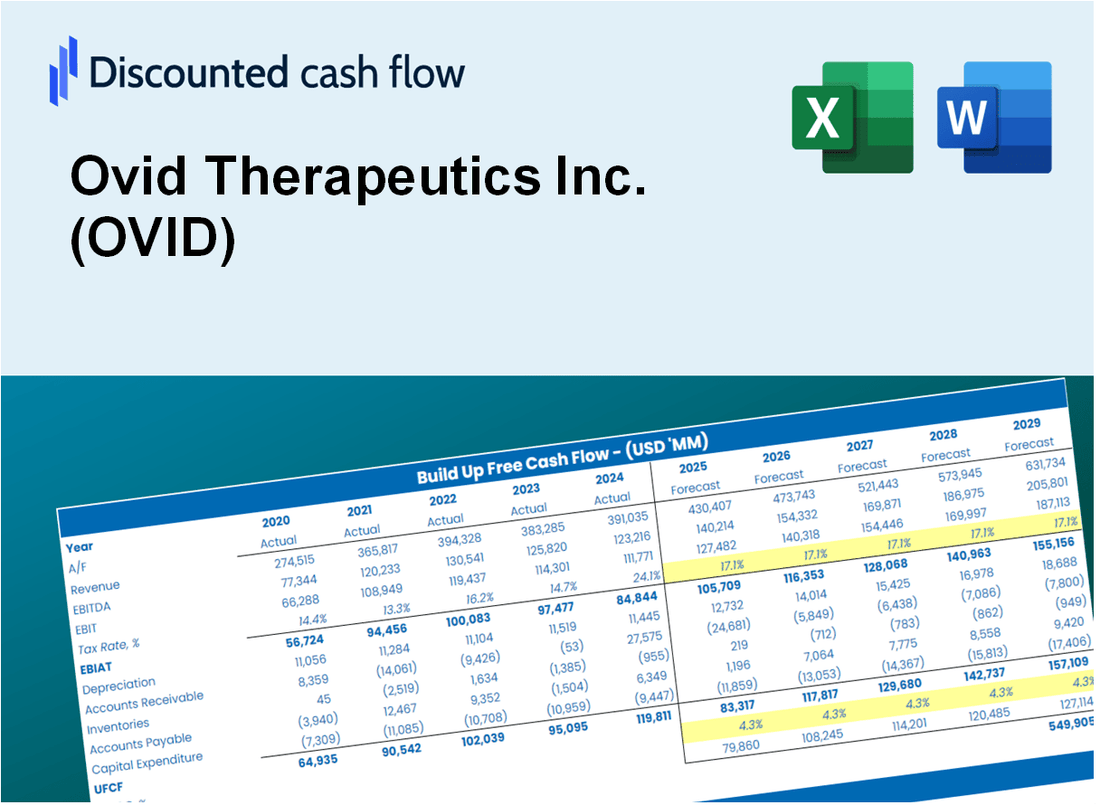
Valoración DCF de Ovid Therapeutics Inc. (OVID) |
Completamente Editable: Adáptelo A Sus Necesidades En Excel O Sheets
Diseño Profesional: Plantillas Confiables Y Estándares De La Industria
Predeterminadas Para Un Uso Rápido Y Eficiente
Compatible con MAC / PC, completamente desbloqueado
No Se Necesita Experiencia; Fáciles De Seguir
Ovid Therapeutics Inc. (OVID) Bundle
¿Busca evaluar el valor intrínseco de Ovid Therapeutics Inc.? Nuestra calculadora DCF (OVID) integra datos reales con características de personalización integrales, lo que le permite refinar sus proyecciones y mejorar sus opciones de inversión.
Discounted Cash Flow (DCF) - (USD MM)
| Year | AY1 2020 |
AY2 2021 |
AY3 2022 |
AY4 2023 |
AY5 2024 |
FY1 2025 |
FY2 2026 |
FY3 2027 |
FY4 2028 |
FY5 2029 |
|---|---|---|---|---|---|---|---|---|---|---|
| Revenue | 12.6 | 208.4 | 1.5 | .4 | .6 | .5 | .5 | .5 | .4 | .4 |
| Revenue Growth, % | 0 | 1551.6 | -99.28 | -73.94 | 44.5 | -7.18 | -7.18 | -7.18 | -7.18 | -7.18 |
| EBITDA | -81.1 | 124.4 | -54.2 | -57.0 | -57.8 | -.4 | -.3 | -.3 | -.3 | -.3 |
| EBITDA, % | -642.97 | 59.7 | -3603.86 | -14555.46 | -10207.07 | -68.06 | -68.06 | -68.06 | -68.06 | -68.06 |
| Depreciation | .3 | .2 | 1.4 | .6 | .6 | .3 | .3 | .3 | .2 | .2 |
| Depreciation, % | 2.43 | 0.11373 | 91.95 | 145.01 | 108.3 | 58.9 | 58.9 | 58.9 | 58.9 | 58.9 |
| EBIT | -81.4 | 124.2 | -55.5 | -57.6 | -58.4 | -.4 | -.3 | -.3 | -.3 | -.3 |
| EBIT, % | -645.41 | 59.58 | -3695.81 | -14700.47 | -10315.37 | -68.08 | -68.08 | -68.08 | -68.08 | -68.08 |
| Total Cash | 72.0 | 187.8 | 129.0 | 105.8 | 53.1 | .5 | .5 | .4 | .4 | .4 |
| Total Cash, percent | .0 | .0 | .0 | .0 | .0 | .0 | .0 | .0 | .0 | .0 |
| Account Receivables | .1 | .0 | .0 | .0 | .0 | .0 | .0 | .0 | .0 | .0 |
| Account Receivables, % | 1.12 | 0 | 0 | 0 | 0 | 0.22472 | 0.22472 | 0.22472 | 0.22472 | 0.22472 |
| Inventories | .0 | .0 | .0 | .0 | .0 | .0 | .0 | .0 | .0 | .0 |
| Inventories, % | 0 | 0 | 0 | 0 | 0 | 0 | 0 | 0 | 0 | 0 |
| Accounts Payable | 5.4 | 7.1 | 2.0 | 3.7 | 3.2 | .4 | .3 | .3 | .3 | .3 |
| Accounts Payable, % | 43.17 | 3.42 | 129.93 | 945.36 | 563.78 | 69.32 | 69.32 | 69.32 | 69.32 | 69.32 |
| Capital Expenditure | -.4 | -.2 | -1.4 | -.1 | -.1 | -.2 | -.1 | -.1 | -.1 | -.1 |
| Capital Expenditure, % | -3.1 | -0.09089417 | -94.4 | -35.09 | -12.54 | -29.04 | -29.04 | -29.04 | -29.04 | -29.04 |
| Tax Rate, % | 0 | 0 | 0 | 0 | 0 | 0 | 0 | 0 | 0 | 0 |
| EBITAT | -81.4 | 122.8 | -55.5 | -57.6 | -58.4 | -.4 | -.3 | -.3 | -.3 | -.3 |
| Depreciation | ||||||||||
| Changes in Account Receivables | ||||||||||
| Changes in Inventories | ||||||||||
| Changes in Accounts Payable | ||||||||||
| Capital Expenditure | ||||||||||
| UFCF | -76.2 | 124.7 | -60.8 | -55.4 | -58.4 | -3.0 | -.2 | -.2 | -.2 | -.2 |
| WACC, % | 5.22 | 5.22 | 5.22 | 5.22 | 5.22 | 5.22 | 5.22 | 5.22 | 5.22 | 5.22 |
| PV UFCF | ||||||||||
| SUM PV UFCF | -3.5 | |||||||||
| Long Term Growth Rate, % | 2.00 | |||||||||
| Free cash flow (T + 1) | 0 | |||||||||
| Terminal Value | -5 | |||||||||
| Present Terminal Value | -4 | |||||||||
| Enterprise Value | -8 | |||||||||
| Net Debt | -12 | |||||||||
| Equity Value | 4 | |||||||||
| Diluted Shares Outstanding, MM | 71 | |||||||||
| Equity Value Per Share | 0.05 |
What You Will Get
- Editable Excel Template: A fully customizable Excel-based DCF Calculator featuring pre-filled real OVID financials.
- Real-World Data: Historical data and forward-looking estimates (as indicated in the highlighted cells).
- Forecast Flexibility: Adjust forecast assumptions such as revenue growth, EBITDA %, and WACC.
- Automatic Calculations: Instantly observe the effects of your inputs on Ovid Therapeutics' valuation.
- Professional Tool: Designed for investors, CFOs, consultants, and financial analysts.
- User-Friendly Design: Organized for clarity and ease of navigation, complete with step-by-step instructions.
Key Features
- Comprehensive Data: Ovid Therapeutics Inc.'s historical financial statements and pre-filled projections.
- Customizable Inputs: Modify WACC, tax rates, revenue growth, and EBITDA margins to fit your analysis.
- Real-Time Results: Observe Ovid's intrinsic value recalculating instantly.
- Visual Data Representation: Dashboard charts illustrate valuation outcomes and essential metrics.
- Designed for Precision: A professional-grade tool tailored for analysts, investors, and finance professionals.
How It Works
- Download the Template: Gain immediate access to the Excel-based OVID DCF Calculator.
- Input Your Assumptions: Modify the yellow-highlighted cells for growth rates, WACC, margins, and other variables.
- Instant Calculations: The model automatically recalculates Ovid Therapeutics' intrinsic value.
- Test Scenarios: Experiment with various assumptions to assess potential changes in valuation.
- Analyze and Decide: Utilize the results to inform your investment or financial decisions.
Why Choose Ovid Therapeutics Inc. (OVID)?
- Innovative Solutions: Focused on developing therapies for rare neurological diseases.
- Scientific Expertise: Led by a team of experienced professionals in neuroscience and drug development.
- Robust Pipeline: Diverse range of product candidates targeting unmet medical needs.
- Strong Partnerships: Collaborations with leading academic institutions and biopharmaceutical companies.
- Commitment to Patients: Dedicated to improving the lives of patients and their families.
Who Should Use This Product?
- Investors: Accurately assess Ovid Therapeutics Inc.’s (OVID) fair value prior to making investment choices.
- CFOs: Utilize a professional-grade DCF model for comprehensive financial reporting and analysis.
- Consultants: Efficiently modify the template for valuation reports tailored to clients.
- Entrepreneurs: Acquire insights into financial modeling practices employed by leading biotech firms.
- Educators: Implement it as a teaching resource to illustrate various valuation methodologies.
What the Template Contains
- Preloaded OVID Data: Historical and projected financial data, including revenue, EBIT, and capital expenditures.
- DCF and WACC Models: Professional-grade sheets for calculating intrinsic value and Weighted Average Cost of Capital.
- Editable Inputs: Yellow-highlighted cells for adjusting revenue growth, tax rates, and discount rates.
- Financial Statements: Comprehensive annual and quarterly financials for deeper analysis.
- Key Ratios: Profitability, leverage, and efficiency ratios to evaluate performance.
- Dashboard and Charts: Visual summaries of valuation outcomes and assumptions.
Disclaimer
All information, articles, and product details provided on this website are for general informational and educational purposes only. We do not claim any ownership over, nor do we intend to infringe upon, any trademarks, copyrights, logos, brand names, or other intellectual property mentioned or depicted on this site. Such intellectual property remains the property of its respective owners, and any references here are made solely for identification or informational purposes, without implying any affiliation, endorsement, or partnership.
We make no representations or warranties, express or implied, regarding the accuracy, completeness, or suitability of any content or products presented. Nothing on this website should be construed as legal, tax, investment, financial, medical, or other professional advice. In addition, no part of this site—including articles or product references—constitutes a solicitation, recommendation, endorsement, advertisement, or offer to buy or sell any securities, franchises, or other financial instruments, particularly in jurisdictions where such activity would be unlawful.
All content is of a general nature and may not address the specific circumstances of any individual or entity. It is not a substitute for professional advice or services. Any actions you take based on the information provided here are strictly at your own risk. You accept full responsibility for any decisions or outcomes arising from your use of this website and agree to release us from any liability in connection with your use of, or reliance upon, the content or products found herein.