
|
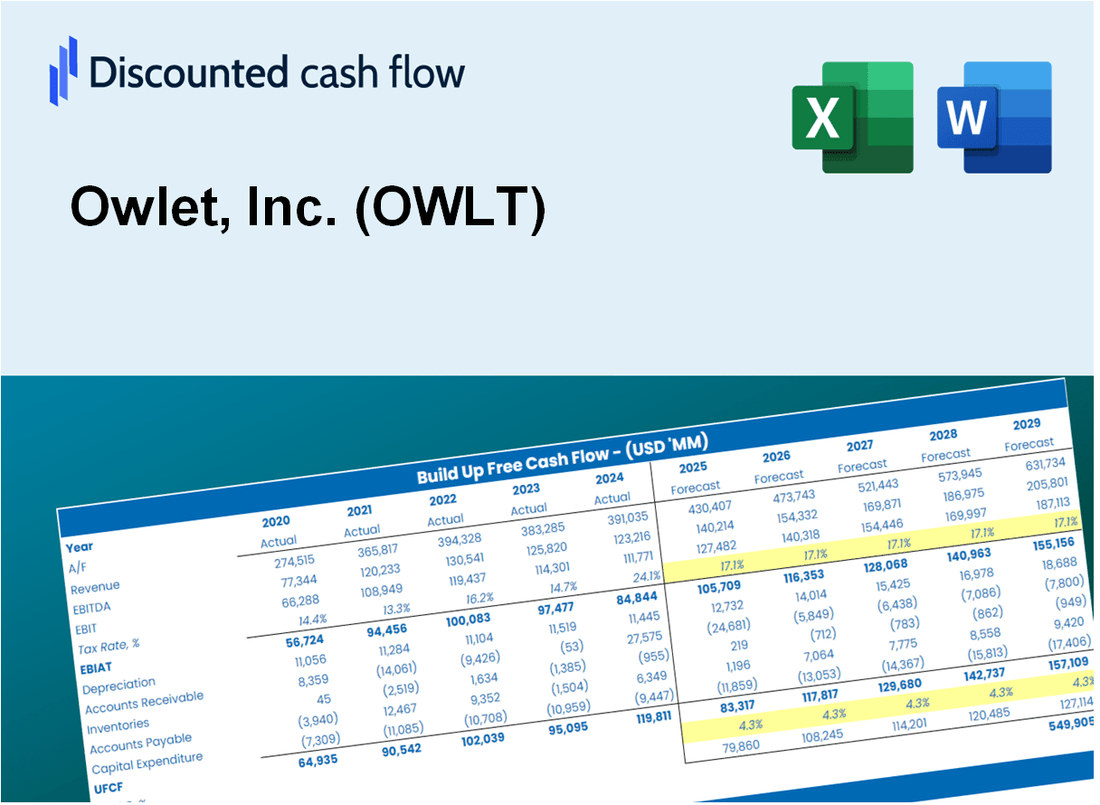
Valoración DCF de Owlet, Inc. (OWLT) |
Completamente Editable: Adáptelo A Sus Necesidades En Excel O Sheets
Diseño Profesional: Plantillas Confiables Y Estándares De La Industria
Predeterminadas Para Un Uso Rápido Y Eficiente
Compatible con MAC / PC, completamente desbloqueado
No Se Necesita Experiencia; Fáciles De Seguir
Owlet, Inc. (OWLT) Bundle
Diseñada para la precisión, nuestra calculadora DCF Owlet, Inc. (OWLT) le permite evaluar la valoración de Owlet utilizando datos financieros del mundo real al tiempo que proporciona flexibilidad completa para modificar todos los parámetros esenciales para mejorar las proyecciones.
Discounted Cash Flow (DCF) - (USD MM)
| Year | AY1 2020 |
AY2 2021 |
AY3 2022 |
AY4 2023 |
AY5 2024 |
FY1 2025 |
FY2 2026 |
FY3 2027 |
FY4 2028 |
FY5 2029 |
|---|---|---|---|---|---|---|---|---|---|---|
| Revenue | 75.4 | 75.8 | 69.2 | 54.0 | 78.1 | 80.9 | 83.8 | 86.8 | 89.9 | 93.1 |
| Revenue Growth, % | 0 | 0.5822 | -8.76 | -21.95 | 44.52 | 3.6 | 3.6 | 3.6 | 3.6 | 3.6 |
| EBITDA | -8.2 | -42.7 | -75.5 | -27.5 | -9.5 | -37.2 | -38.6 | -40.0 | -41.4 | -42.9 |
| EBITDA, % | -10.94 | -56.31 | -109.15 | -50.9 | -12.13 | -46.06 | -46.06 | -46.06 | -46.06 | -46.06 |
| Depreciation | .9 | 1.1 | 2.7 | 2.2 | 1.4 | 2.0 | 2.1 | 2.1 | 2.2 | 2.3 |
| Depreciation, % | 1.16 | 1.49 | 3.86 | 4.09 | 1.77 | 2.47 | 2.47 | 2.47 | 2.47 | 2.47 |
| EBIT | -9.1 | -43.8 | -78.2 | -29.7 | -10.9 | -38.6 | -40.0 | -41.4 | -42.9 | -44.5 |
| EBIT, % | -12.09 | -57.8 | -113.01 | -54.99 | -13.9 | -47.76 | -47.76 | -47.76 | -47.76 | -47.76 |
| Total Cash | 17.0 | 95.1 | 11.2 | 16.6 | 20.2 | 31.6 | 32.7 | 33.9 | 35.1 | 36.4 |
| Total Cash, percent | .0 | .0 | .0 | .0 | .0 | .0 | .0 | .0 | .0 | .0 |
| Account Receivables | 10.5 | 10.5 | 16.0 | 14.0 | 12.1 | 14.9 | 15.5 | 16.0 | 16.6 | 17.2 |
| Account Receivables, % | 13.96 | 13.8 | 23.06 | 25.87 | 15.55 | 18.45 | 18.45 | 18.45 | 18.45 | 18.45 |
| Inventories | 7.9 | 18.0 | 18.5 | 6.5 | 10.5 | 14.0 | 14.5 | 15.0 | 15.5 | 16.1 |
| Inventories, % | 10.49 | 23.71 | 26.76 | 12.02 | 13.48 | 17.29 | 17.29 | 17.29 | 17.29 | 17.29 |
| Accounts Payable | 16.4 | 27.8 | 30.4 | 13.7 | 11.3 | 23.0 | 23.8 | 24.7 | 25.6 | 26.5 |
| Accounts Payable, % | 21.72 | 36.61 | 43.98 | 25.33 | 14.45 | 28.42 | 28.42 | 28.42 | 28.42 | 28.42 |
| Capital Expenditure | -1.1 | -2.0 | -1.6 | -.1 | -.8 | -1.2 | -1.2 | -1.3 | -1.3 | -1.4 |
| Capital Expenditure, % | -1.4 | -2.66 | -2.26 | -0.10924 | -0.97494 | -1.48 | -1.48 | -1.48 | -1.48 | -1.48 |
| Tax Rate, % | -0.43262 | -0.43262 | -0.43262 | -0.43262 | -0.43262 | -0.43262 | -0.43262 | -0.43262 | -0.43262 | -0.43262 |
| EBITAT | -9.1 | -43.9 | -78.2 | -29.7 | -10.9 | -38.6 | -40.0 | -41.4 | -42.9 | -44.5 |
| Depreciation | ||||||||||
| Changes in Account Receivables | ||||||||||
| Changes in Inventories | ||||||||||
| Changes in Accounts Payable | ||||||||||
| Capital Expenditure | ||||||||||
| UFCF | -11.4 | -43.4 | -80.5 | -30.3 | -14.9 | -32.4 | -39.4 | -40.8 | -42.3 | -43.8 |
| WACC, % | 12.25 | 12.25 | 12.25 | 12.25 | 12.25 | 12.25 | 12.25 | 12.25 | 12.25 | 12.25 |
| PV UFCF | ||||||||||
| SUM PV UFCF | -140.1 | |||||||||
| Long Term Growth Rate, % | 2.00 | |||||||||
| Free cash flow (T + 1) | -45 | |||||||||
| Terminal Value | -436 | |||||||||
| Present Terminal Value | -244 | |||||||||
| Enterprise Value | -385 | |||||||||
| Net Debt | -8 | |||||||||
| Equity Value | -376 | |||||||||
| Diluted Shares Outstanding, MM | 15 | |||||||||
| Equity Value Per Share | -24.90 |
What You Will Get
- Real OWLT Financials: Access to historical and projected data for precise valuation.
- Customizable Inputs: Adjust WACC, tax rates, revenue growth, and capital expenditures as needed.
- Real-Time Calculations: Intrinsic value and NPV are computed automatically.
- Scenario Analysis: Evaluate various scenarios to assess Owlet’s future performance.
- User-Friendly Design: Designed for professionals while remaining approachable for newcomers.
Key Features
- Comprehensive Data: Owlet’s historical financial statements and pre-filled projections.
- Customizable Parameters: Adjust WACC, tax rates, revenue growth, and EBITDA margins as needed.
- Real-Time Insights: View Owlet’s intrinsic value update instantly.
- Intuitive Visualizations: Dashboard graphs present valuation outcomes and essential metrics.
- Designed for Precision: A specialized tool for analysts, investors, and finance professionals.
How It Works
- Step 1: Download the prebuilt Excel template with Owlet, Inc.'s (OWLT) data included.
- Step 2: Explore the pre-filled sheets and familiarize yourself with the key metrics.
- Step 3: Update forecasts and assumptions in the editable yellow cells (WACC, growth, margins).
- Step 4: Instantly view recalculated results, including Owlet, Inc.'s (OWLT) intrinsic value.
- Step 5: Make informed investment decisions or generate reports using the outputs.
Why Choose This Calculator?
- User-Friendly Interface: Perfectly crafted for both novices and seasoned users.
- Customizable Inputs: Adjust parameters easily to suit your financial analysis.
- Real-Time Feedback: Observe immediate updates to Owlet, Inc. (OWLT)’s valuation as you modify inputs.
- Preloaded Data: Comes equipped with Owlet, Inc. (OWLT)’s latest financial information for swift evaluations.
- Preferred by Experts: Widely utilized by investors and analysts for making well-informed choices.
Who Should Use This Product?
- Parents: Understand how Owlet's monitoring technology can enhance your baby's safety and sleep quality.
- Pediatricians: Integrate Owlet's data-driven insights into patient care and family consultations.
- Investors: Evaluate potential returns and market trends related to Owlet, Inc. (OWLT).
- Health Enthusiasts: Explore the benefits of sleep monitoring and how it can improve overall wellness.
- Retailers: Discover the growing demand for smart baby products and how to position Owlet in your inventory.
What the Template Contains
- Pre-Filled DCF Model: Owlet, Inc.’s (OWLT) financial data preloaded for immediate use.
- WACC Calculator: Detailed calculations for Weighted Average Cost of Capital.
- Financial Ratios: Evaluate Owlet, Inc.’s (OWLT) profitability, leverage, and efficiency.
- Editable Inputs: Change assumptions such as growth, margins, and CAPEX to fit your scenarios.
- Financial Statements: Annual and quarterly reports to support detailed analysis.
- Interactive Dashboard: Easily visualize key valuation metrics and results.
Disclaimer
All information, articles, and product details provided on this website are for general informational and educational purposes only. We do not claim any ownership over, nor do we intend to infringe upon, any trademarks, copyrights, logos, brand names, or other intellectual property mentioned or depicted on this site. Such intellectual property remains the property of its respective owners, and any references here are made solely for identification or informational purposes, without implying any affiliation, endorsement, or partnership.
We make no representations or warranties, express or implied, regarding the accuracy, completeness, or suitability of any content or products presented. Nothing on this website should be construed as legal, tax, investment, financial, medical, or other professional advice. In addition, no part of this site—including articles or product references—constitutes a solicitation, recommendation, endorsement, advertisement, or offer to buy or sell any securities, franchises, or other financial instruments, particularly in jurisdictions where such activity would be unlawful.
All content is of a general nature and may not address the specific circumstances of any individual or entity. It is not a substitute for professional advice or services. Any actions you take based on the information provided here are strictly at your own risk. You accept full responsibility for any decisions or outcomes arising from your use of this website and agree to release us from any liability in connection with your use of, or reliance upon, the content or products found herein.